2. Workshop Advanced usage of viiaPackage (Day 1)
The first day of the workshop focusses on the topics ‘strengthening’ and ‘result handling’ within the NLTH analysis process. This page contains the materials, the recorded instructions and solutions to the exercises.
2.1. General procedure for NLTH model development and analysis with viiaPackage
The general procedure for NLTH is shown in the following figure. This workflow focusses on the model, for the complete NLTH workflow refer to the protocol.
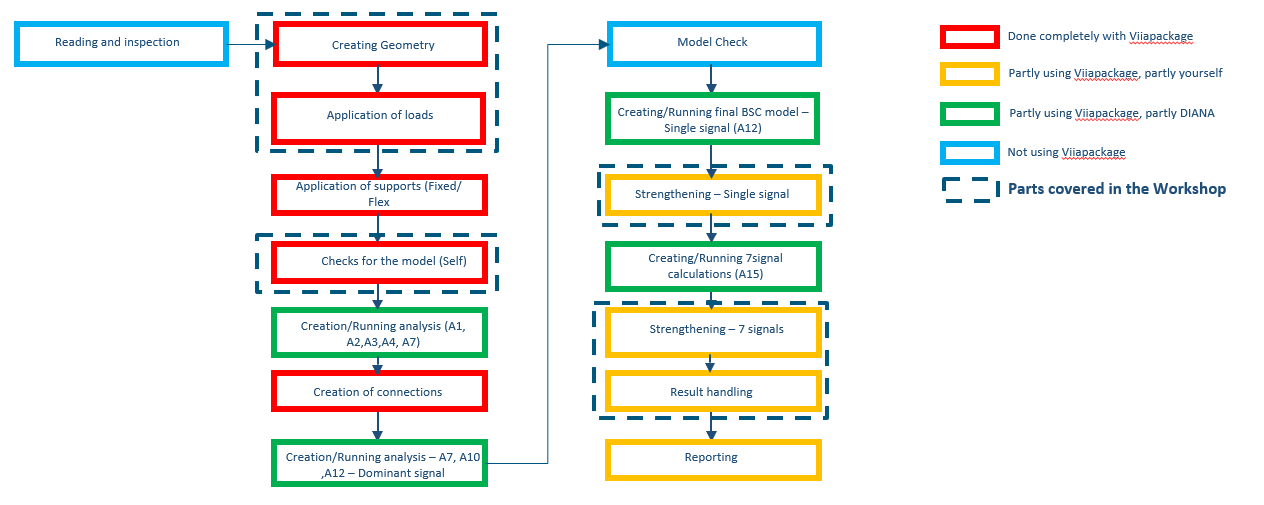
Figure 2.35 General NLTH model procedure.
2.2. Strengthening
2.2.1. Strengthening measures in the GMC
Within the GMC there are 8 categories of strengthening measures:
Category |
Measure for |
Description |
|---|---|---|
L1 |
Eliminating acute hazards |
Stabilizing elements preventing acute damage like chimney, ducts |
L2 |
Connections |
Coupling different structural/non-structural elements to ensure efficient transfer of forces eg. wall and floor. |
L3 |
Floors and roofs |
Improving diaphragm action (shear capacity) |
L4 |
Walls (out-of-plane) |
Improving the out-of-plane capacity of walls (both load and non-load bearing). |
L5 |
Walls (in-plane) |
Improving the in-plane capacity of walls(both load and non-load bearing) |
L6 |
Foundation |
Improving the bearing capacity of the foundation to ensure transfer of forces to the soil. |
L7 |
Demolition |
Removal of the element from the building |
L8 |
Global behaviour change |
Changing the global behavior of the structure so as not have any additional measures eg. base isolation. |
Table 2.1 - Strengthening measures in the GMC.
2.2.2. Strengthening measures in DIANA
Applying measures in DIANA model:
Category |
Application in DIANA |
|
|---|---|---|
L1 |
Not required to model in DIANA. |
|
L2 |
Application of a linear interface and reporting the interface stresses |
|
L3 |
Changing the properties of the floor/roof + addition of existing mass (changing input through viiaPackage) – Will be implemented later. |
|
L4 |
Some via functions in viiaPackage and some in DIANA |
|
L5 |
Some via functions in viiaPackage and some in DIANA |
|
L6 |
Some via functions in viiaPackage and some in DIANA |
|
L7 |
Not required to model in DIANA. |
|
L8 |
Not implemented. |
|
Table 2.2 - Application of strengthening measures in the NLTH model.
The available strengthening measures in the viiaPackage are (bold indicated measures are working):
L2 (linear interface)
L4 – L4-B, L4-F, L4-I, L4-O, L4-R, L4-D
L5 – L5-A, L5-B, L5-N, L5-P
L6 – L6-J
2.2.3. Workflow for strengthening
Required input from user for strengthening functions – shape_name/shape_object generally
Default input – This is generally provided from offset values (top and bottom), spacing between members (eg. L4-F, L4-D). Should be given in input argument as per user requirement.
Note: when strengthening is added to an element (wall/floor), its meta_data attribute is filled in with the strengthening measure.
wall.meta_data('strengthening') = 'L4-F'
For details regarding connections, refer to the material from ‘Connections workshop’.
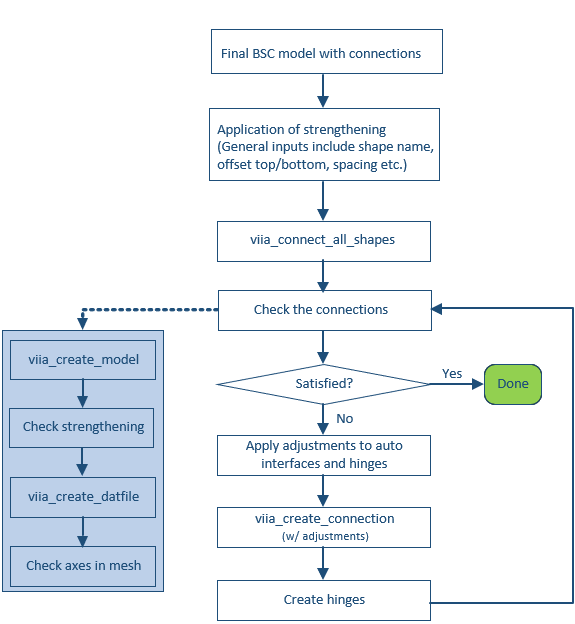
Figure 2.36 Workflow applying strengthening measures in NLTH model.
2.2.4. Measure L4-F
This section shows how to apply the L4-F in the NLTH model.
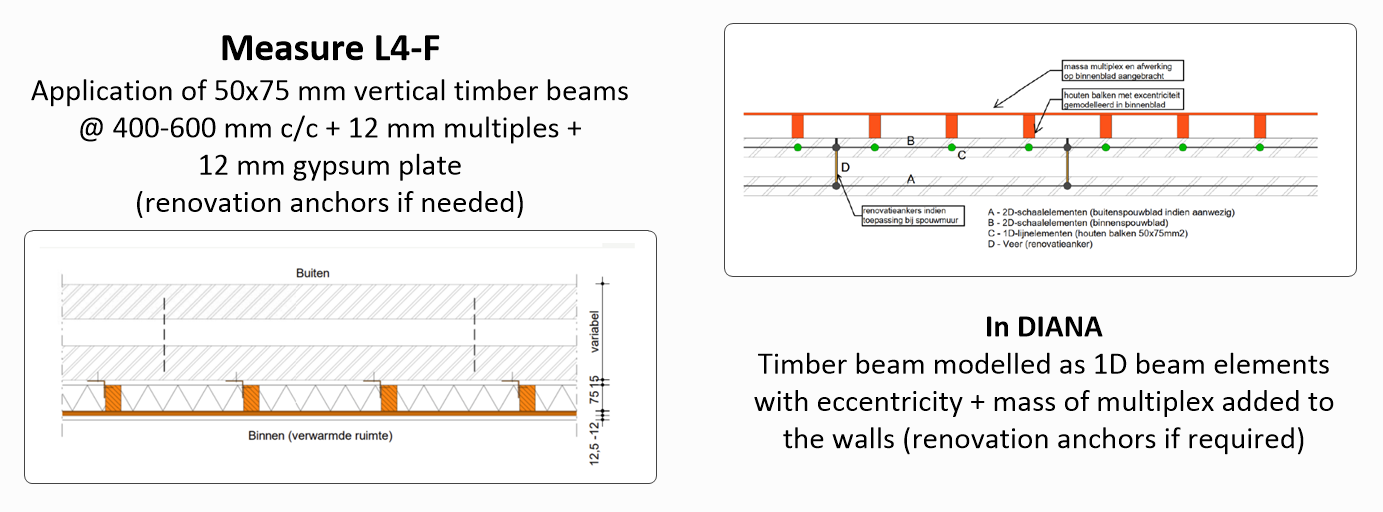
Figure 2.37 Information on strengthening measure L4-F.
Applying the L4-F measure using the viiaPackage:
project.viia_l4f()
2.2.5. Measure L4-D
This section shows how to apply the L4-D in the NLTH model.
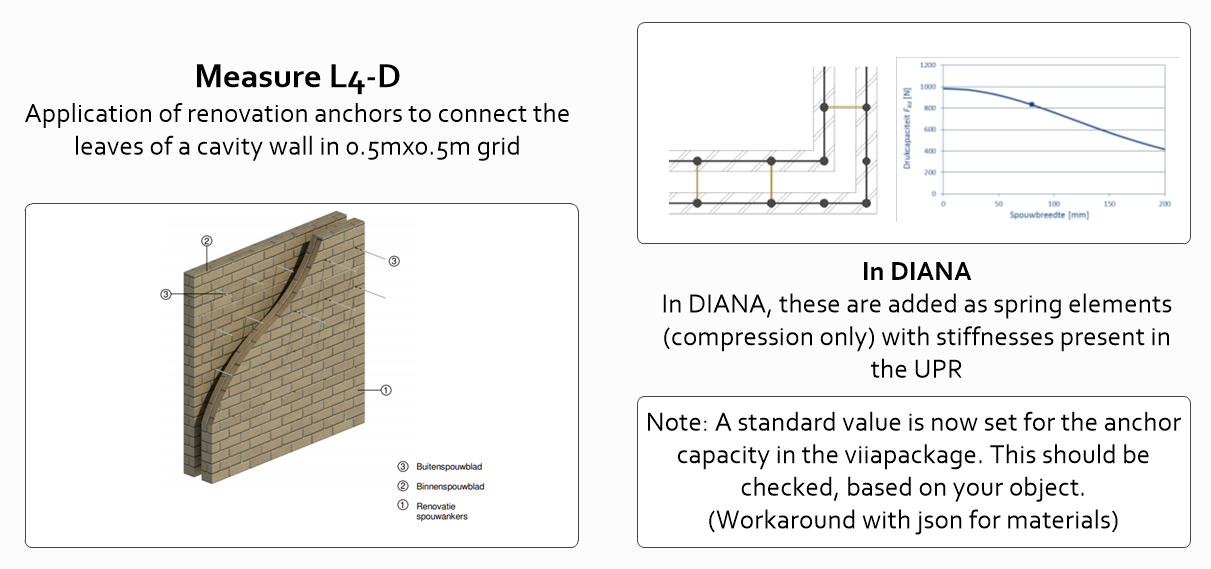
Figure 2.38 Information on strengthening measure L4-D.
Applying the L4-D measure using the viiaPackage:
project.viia_l4d()
2.2.6. Measure L5-P
This section shows how to apply the L5-P in the NLTH model.
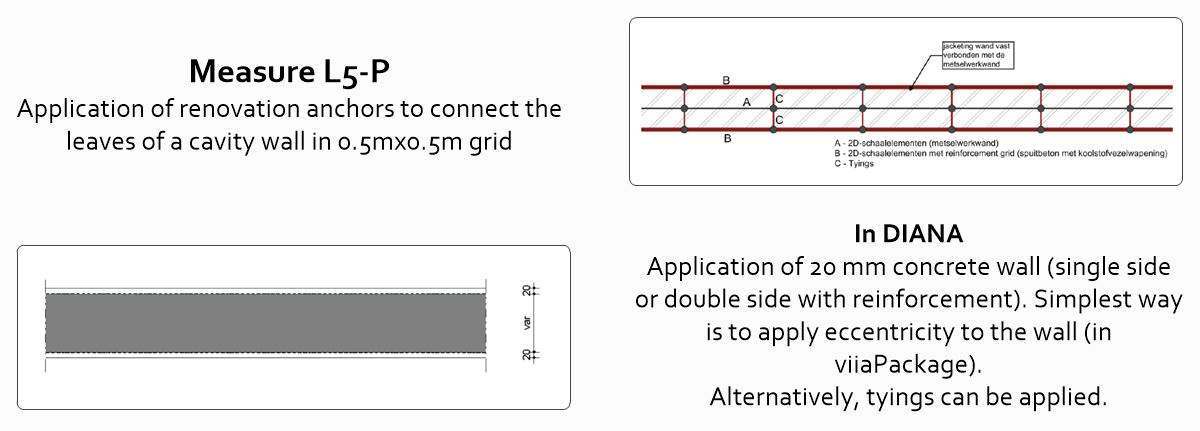
Figure 2.39 Information on strengthening measure L5-P.
Applying the L5-P measure using the viiaPackage:
project.viia_l5p()
2.2.7. Instructions on applying strengthening measures
The following recording shows the instructions on how to apply strengthening measures in NLTH:

Figure 2.40 Instructions on applying strengthening in the NLTH model.
All excercises are to be executed on the following model:
2.2.8. Excercise 1 - Applying the measure
Add the measure ‘L4-F’ to the wall with name ‘N1-WANDEN-MW-KLEI<1945-150-8’ on the inside.
Solution
The following recording shows the solution of the excercise:

Figure 2.41 Instructions on solution of excercise 1.
Create the L4-F measure:
project.viia_l4f('N1-WANDEN-MW-KLEI<1945-150-8', flip=True)
Note: The columns are not created above openings. If the measure is applied to walls with openings, L4-G should be applied. The other elements around the opening and above need to be manually added by the user right now.
2.2.9. Excercise 2 - Parts of the function not working
Add the measure ‘L4-F’ to the wall with name ‘N0-WANDEN-MW-KLEI<1945-150-2’. Check the applied measures in DIANA and do the necessary changes (if any).
Note
For this example we provide you with a broken function l4-F in the script itself.
Solution
The following recording shows the solution of the excercise:

Figure 2.42 Instructions on solution of excercise 2.
Create the L4-F measure:
project.viia_l4f(wall='N0-WANDEN-MW-KLEI<1945-150-2')
The eccentricity is not added, this needs to be added after viia_create_model().
wall_thickness = fem_find_object(
    'N0-WANDEN-MW-KLEI<1945-150-2', project.collections.walls).geometry.geometry_model.thickness
column_height = fem_find_object(
    'N0-KOLOMMEN-L4F-WAND2-LIN-HOUT-KOLOM-50x75-4', project.collections.columns).geometry.geometry_model.height
project.haskoningDIANA.setParameter(
    'GEOMET', 'KOLOM-L4F-50x75-(1,0,0)', 'ECCENT', True)
project.haskoningDIANA.setParameter(
    'GEOMET', 'KOLOM-L4F-50x75-(1,0,0)', 'ECCENT/ECCENY', -0.5*(wall_thickness+column_height))
2.2.10. Excercise 3 - Application of measure not available
Apply the measure ‘L3-A’ on the floor with name ‘N1-VLOEREN-LIN-HBV-PLANKEN-0.018-0.080-0.200-0.770-1’.
Note
This measure is not currently present in the viiaPackage. Also, eccentricity for HBV floors does not have to be applied for now. (For the measure, refer to the UPR)
Solution
The following recording shows the solution of the excercise:

Figure 2.43 Instructions on solution of excercise 3.
floor = fem_find_object('N1-VLOEREN-LIN-HBV-PLANKEN-0.018-0.080-0.200-0.770-1', project.collections.floors)
floor_old_mass_density = floor.material.mass_density
floor_material = project.viia_create_material('LIN-HBV-PLATEN-0.024-0.080-0.200-0.770')
floor.material = floor_material
floor.name = 'N1-VLOEREN-LIN-HBV-PLATEN-0.024-0.080-0.200-0.770-1'
project.viia_adjust_mass_of_surface(floor_old_mass_density*9.81/fem_area(floor.get_points()),floor)
Note
This measure will be added later to the viiaPackage.
2.2.11. Excercise 4 - Combination of measures
Apply the measure L5-R for the wall ‘N1-WANDEN-MW-KLEI<1945-150-5’. This measure is used for the combined in-plane and out-of-plane strengthening of masonry walls. Eg. This can be for structures subjected to torsion. Hint: L5-R is not available in the viiaPackage, but is a combination of two measures L4-F and L5-P.
Solution
The following recording shows the solution of the excercise:

Figure 2.44 Instructions on solution of excercise 4, part 1.

Figure 2.45 Instructions on solution of excercise 4. part 2.
project.viia_l4f(wall='N1-WANDEN-MW-KLEI<1945-150-5', flip = True)
del fem_find_object('N1-WANDEN-MW-KLEI<1945-150-5', project.collections.walls).meta_data['strengthening']
project.viia_l5p(
    wall=fem_find_object('N1-WANDEN-MW-KLEI<1945-150-5', project.collections.walls),
    application_type='Negative’)
It should be noted that this way, the eccentricity of the columns is slightly lesser (by 10 mm) and the strengthening is conservative. An alternative to this could be creating the columns at the exact eccentricity and creating ties with the wall.
2.2.12. Exercise 5 – Measure with a connection
Apply the measure ‘L4-F’ for the wall ‘N0-WANDEN-MW-KLEI<1945-150-7’ without any offsets. The connections were created as part of the package for this wall with the connecting beams/floor.
TODO: Add link to BOX folder for the result files.
Solution
The following recording shows the solution of the exercise:

project.viia_l4f(wall='N0-WANDEN-MW-KLEI<1945-150-7', flip=True, offset_bottom=0.0, offset_top=0.0)
project.viia_connect_all_shapes()
project.viia_auto_interfaces() # Can be any interface function
2.3. Result handling
This section will focus on the result handling of the NLTH analysis.
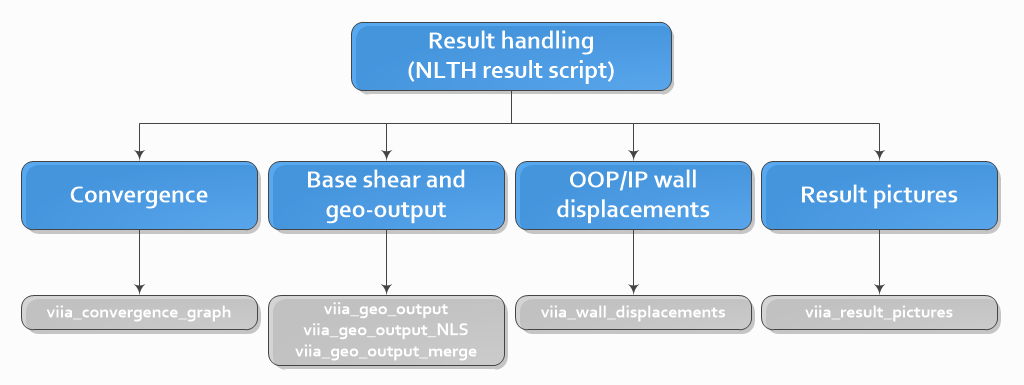
Figure 2.46 Overview of available result handling for NLTH.
2.3.1. Convergence graph
Available in the NLTH result script (template in viiaPackage) within the function viia_results().
Features: Duration of analysis, Converging steps, Relative energy/displacement/force variation, cracking
Input: Out-file of analysis, parameter variation.
Output: Convergence graph for one analysis.
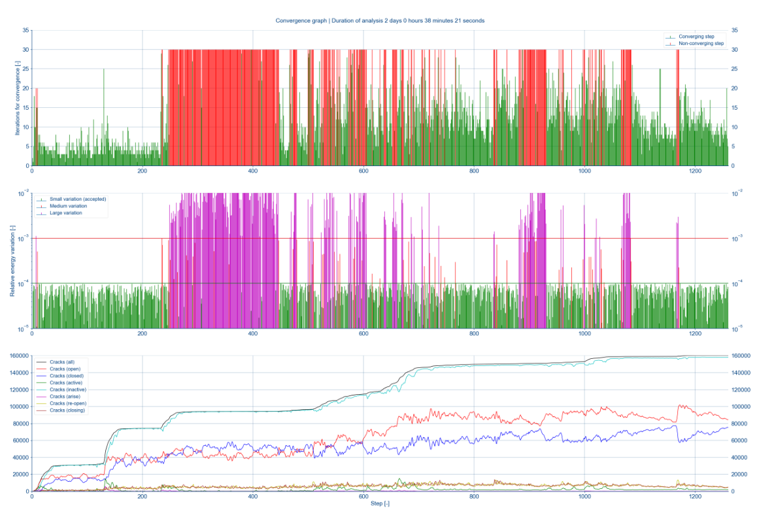
Figure 2.47 Figure 2.13 - Example convergence graph.
2.3.2. Output for geotechnical engineer
Available in the NLTH result script (template in viiaPackage).
Function related to the collecting of geotechnical output:
viia_geo_output – Obtaining the maximum base shear per strip/pile from the signal with the time instant. Indicated green part in Figure 2.14.
viia_geo_output_nls – Obtaining the permanent and variable loads from nonlinear Indicated green part in Figure 2.14.
viia_geo_output_merge – Combining these two results in a format relevant for geo tool
These functions will require the following input and deliver the following output:
Input: .dat , .json, _5A.tb, _5B.tb for all signals (in A12 result folder) and .dat, .json, _5A.tb (in A10 result folder).
Output: A json-file per signal and a single json-file for non-linear static, generated in working folder (both files would contain the dimensions and coordinates of the foundation element).
The functions create different parts of the json-file. These are indicated in the following figure:
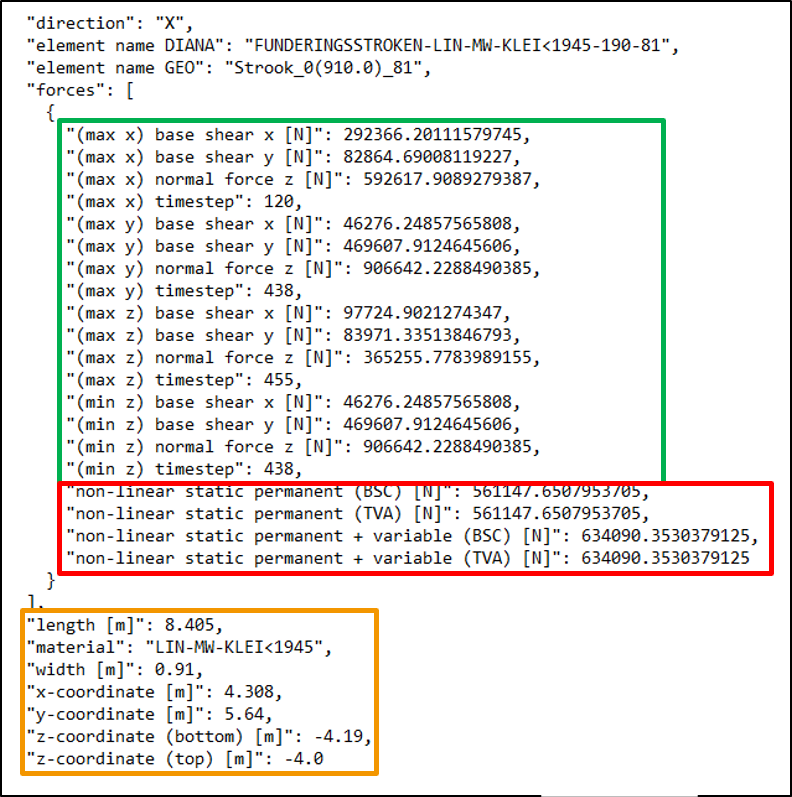
Figure 2.48 Json-file for output for geotechnical assessment.
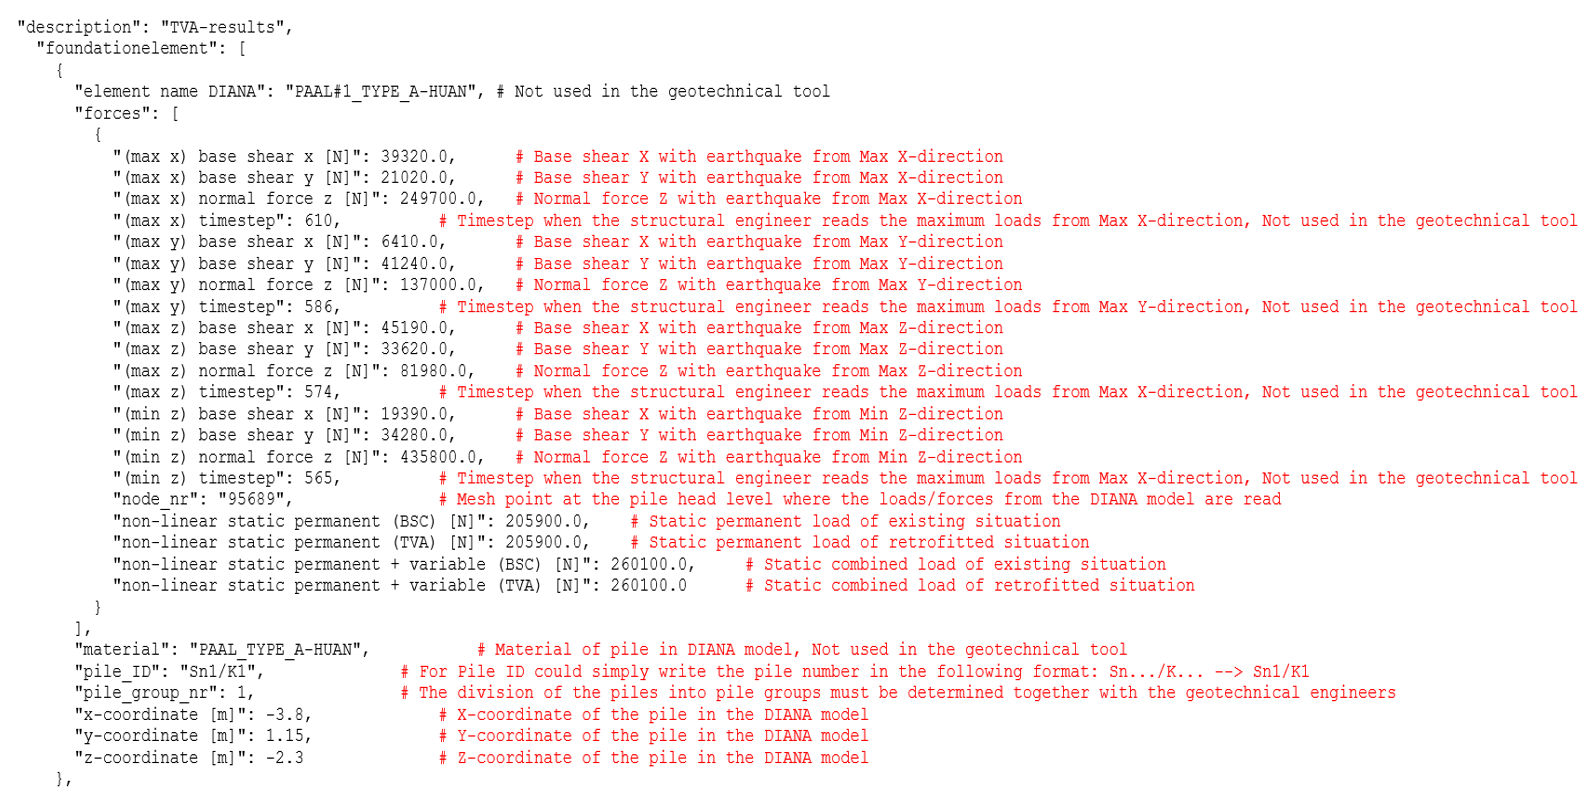
Figure 2.49 Explanation of the elements in the geotechnical output.for output for geotechnical assessment.
2.3.3. Base shear
The base shear result handling is part of the result handling (also generated within the Geo output functions if needed for all 7 signals) in the NLTH result-script. The function can also be used seperately:
viia_base_shear - Create the base shear graph.
This functions will require the following input and deliver the following output:
Input: _5A.tb file, analysis object.
Output: Base shear graph.
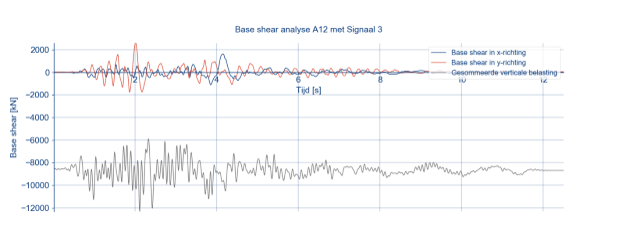
Figure 2.50 Example base shear graph.
2.3.4. OOP/IP displacements
The wall displacement result handling is part of the result handling in the NLTH result-script. The function can also be used seperately:
viia_wall_displacements
This functions will require the following input and deliver the following output:
Input: OUTPUT_2.tb, list of walls (can be obtained from .json).
Output: The OOP/IP displacement and total displacements per wall along the duration of signal created as png-file in the folder OOP_IP_displacements within the working folder.
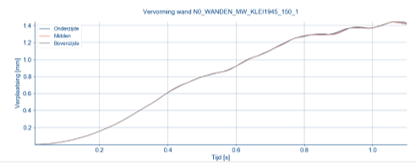
Figure 2.51 Example wall-displacements graph.
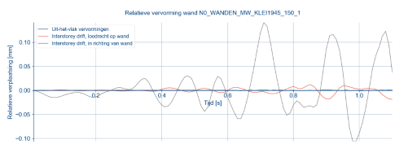
Figure 2.52 Example relative wall-displacements graph.
2.3.5. Result pictures
The result pictures part of the result handling is done in the NLTH result-script. The functions can also be used seperately:
viia_create_result_pictures
This functions will require the following input and deliver the following output:
Input Files: .json, .dat, OUTPUT_4.tb, OUTPUT_1A_max.dnb, OUTPUT_1B_min.dnb, OUTPUT_MOVIE.
Output: The result pictures are created in the analysis folder. Main results are added in the documentation - LINK
Note
Alternative result pictures script is available (more based on DIANA commands). Pictures of reinforcements are not created.
Generic input for pictures:
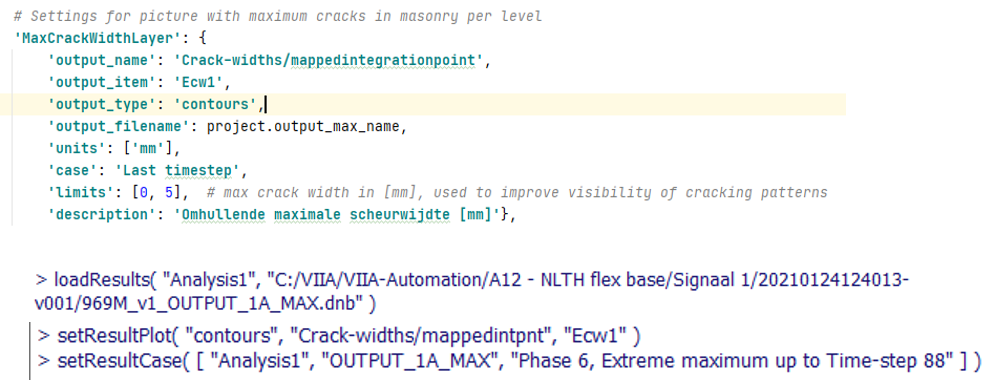
Figure 2.53 Result picture object.
For creating the result picture dictionary – has a default dictionary of pictures.
Structure – Name of picture (key) : Selected shapes/elements (value)
Eg. Dynamic-DispX-Max: Maximum displacement in X – Is created for the building, also for interstorey drift and for walls per storey.
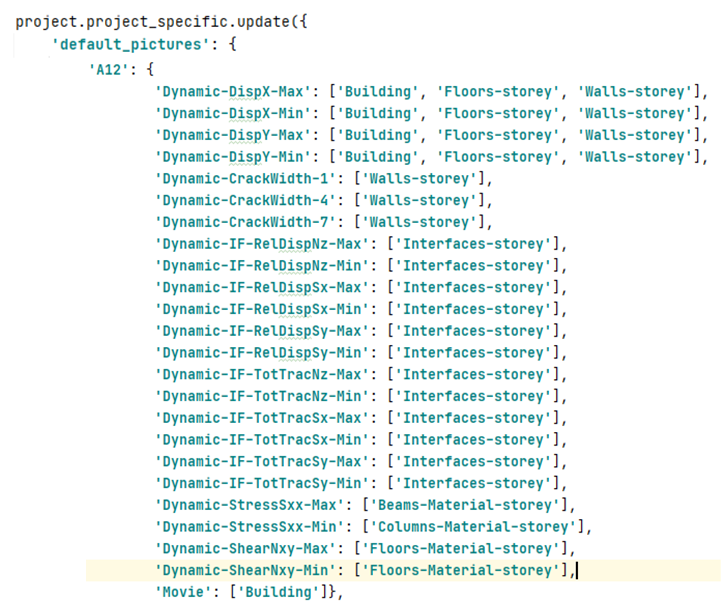
Figure 2.54 Default pictures dictioanry.
2.3.6. Some other result handling features
Movie maker is available as part of result handling script (Required OpenCv-python package): viia_movie_maker.
project.evaluation_step in case of diverged calculations – for BSC calculations can be helpful sometimes
Additional script (as a last resort).
2.3.7. Instructions on result handling
The following recording shows the instructions on how to do result handling in NLTH:

Figure 2.55 Instructions on result handling of NLTH analysis.

Figure 2.56 Instructions on result handling of NLTH analysis, additional explanations.
2.3.8. Excercise 1 - Convergence graph of interrupted analysis
Try creating the convergence graph for the broken out-file in the same folder. Figure out the issue and make the necessary changes to obtain the convergence graph.
Solution
The following recording shows the solution of the excercise:

Figure 2.57 Instructions on solution of excercise 1.
project.viia_convergence_graph(r'location of the convergence outfile')
# Remove the parts of text of the incomplete step from the Convergence.out file
# Re-run the function
2.3.9. Excercise 2 - Base shear of interrupted analysis
The base shear graph is generated as part of the geotechnical output in the workflow. However, the geo-output function is not working. Create the graph in an alternative way.
Exercise script
Model
DIANA dat-file
Result-file
Solution
The following recording shows the solution of the excercise:

Figure 2.24 - Instructions on solution of excercise 1.
# Reading the dump file a
project.viia_read_dump('location of dump file', False)
analysis_object = project.collections.analyses[-1]
project.from_diana(Path('location of dat file'))

# Base shear graph
project.viia_base_shear('location of OUTPUT_5A.tb file',analysis_object)
2.3.10. Excercise 3 - Create result pictures
Make the following changes for the result pictures script. Change to Advanced_Workshop_Result_pictures branch for this.
Fill in the missing details in the result script.
Make the necessary changes w.r.t Analysis object.
Add the evaluation_step to 88.
Change the limits for the crack pictures to have a limit of 20 mm.
Note: It is not necessary to create the result pictures for the exercise
Exercise script
Model
Additional files
Solution
The following recording shows the solution of the excercise:

Part 1
# analysis and signal
analysis_nr = 'A12'
signal = 'S3’

# Work directory
work_dir = Path('path to the directory containing the analysis files')
Part 2
# Using the mainscript, json- and dat-file in the ‘Other files’ folder, recreate the json-file with the analysis
# object (in DIANA)
Part 3
project.evaluation_step = 88 # Added before viia_result_pictures
Part 4
# Change the limits for the crack pictures in ViiaStatus.py in project.diana_settings.result_pictures