How to perform the NLPO suitability check
Diferent from MRS and NLTH analysis types, NLPO method is not suitable for all structures. A guideline to decide if the method is appropriate can be found in figure 3 of the introductory section of this protocol. In the NLPO classical analysis the whole structure is assessed by a conceptualisation of the structure into a simplified model, a single degree of freedom (SDOF) system. In a SDOF system (figure below), the building is simplified to a lumped effective mass located at an effective height. In order to perform this gross simplification, the building should comply with the several aspects already mentioned in figure 3 (introductory section).
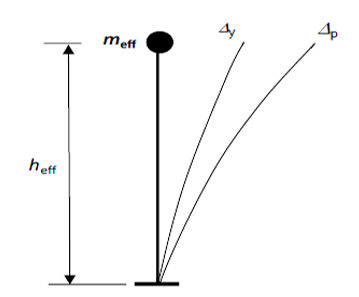
Figure 228 Representation of a SDOF system with an elastic displacement Δy and probable plastic displacement Δp, after applying lateral incremental loads to the building.
The NLPO analysis, as proposed in the NPR9998:2018, allows certain flexibility to the engineer from the typical NLPO requirements. For instance, if the 60% of mass participation is not achieved but there is a clear and logic fundamental mode and the structure presents no other relevant vibration mode then the structure may be modelled as a SDOF, providing this or other evidence to do so (the 60% mass participation minimum is still used in case of presence of a high mode value (above 0.9 seconds, NPR G.4.8)). The norm mentions the possibility to divide the structure in several substructures for structures with flexible or no diaphragms and where the load paths can be clearly identified. This last option is referred in this document as SUBSYSTEM NLPO as mention in the NPR9998:2018 section G.2 (3) but is currently not in used as a possible approach (assessed by SLaMA method), so only cases where a full system according to Figure 3 are covered in this protocol.
The determination of when to use NLPO and its suitability check steps are following mentioned in the following points:
NLPO analysis Pushover curve overview
In the NLPO analysis, an increasing lateral load (e.g. force, displacement, acceleration) is applied to the structure in each analysis load-step. This lateral load is usually applied in a vector that approximates the distribution of inertia forces along the structure height in the direction being considered (NPR9998:2018, G.1 (4)). With the increasing lateral load, the structure goes beyond its elastic range and into its nonlinear response. The number of nonlinear failures forming in structural components then increases until a global mechanism develops, giving the probable lateral force capacity (NPR9998:2018, G.1 (4)). This relation in between incremental force and displacements is called as the “pushover” curve for the building. This pushover (PO) curve reflects global/local characteristic strength for the structure. There are several pushover curves according to the observation point of the displacements and the shear forces per level. When it plotted the base shear to the displacements at the effective height of the building (usually the attic level) the PO curve is usually called the “capacity curve” of the building.
In the figure below it is shown what a capacity curve, there it can be observe that displacements can be related to various structural limit states (review Performance Based Design Engineering topic). The loading continues until the structure reaches its Near Collapse (NC) limit state or explicit collapse is observed in the analysis (NPR9998:2018, G.7.3 (6)).
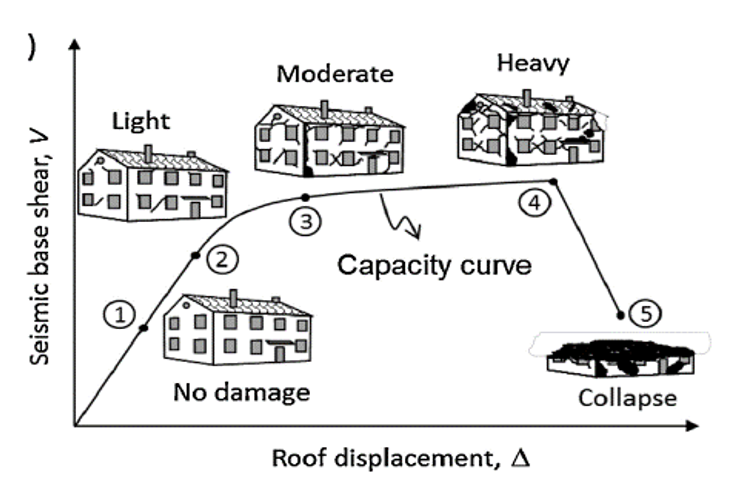
Figure 229 Capacity curve of a buildings can be associated easily to the limit states of structures.
In the single-system NLPO analysis (so where the structure is not splitted like in the SLaMA method), an incremental pushover load (i.e. accelerations) is applied to the model (usually loads only acting on the floors or on floors and walls). The model is to be pushed in both positive and negative directions for the 2 main assessment directions (global X and Y direction).
Pushover load for single SDOF NLPO
According to NPR9998:2018, at least two pushover load patterns should be applied for each analyzed building (NPR9998:2018, G.4.6 (1)). For a SDOF system NLPO analysis, the following two load patterns are recommended (see figure below):
Modal pushover load pattern
Uniform pushover load pattern
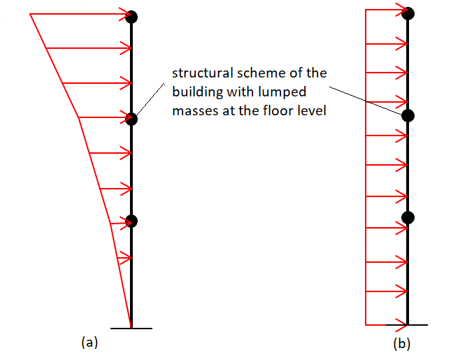
Figure 230 Example of (a) modal pushover load pattern; (b) uniform pushover load pattern.
The modal pushover load is a vertical distribution proportional to the shape of the dominant mode in the direction under consideration (applied usually only at the floors level in the DIANA model). The uniform pushover load is a uniform vertical distribution along the height of the structure (recommended to be applied over the floor and wall elements of the DIANA model). Other elements of the building, such as walls located perpendicular to the acting load and roof elements, are not to be loaded.
In the system NLPO analyses, in total four incremental load cases will be used for each load pattern (usually named as +X, -X, +Y and -Y). From here it can be inferred that at least 8 capacity curves will be found for the building. From the eight results, the most critical case should be selected for each main direction of the building (in this case X and Y). This decision is based on the observed strength and displacements capacities and the expected global failure mode.
Note
A detailed description about the name of the functions of the viiapackage and Haskoning structural package and the arguments required to apply the loads is given in the section Stage 1: Compute the nonlinear pushover capacity.
Control nodes for single SDOF NLPO
The control nodes in this document refers to the nodes in the model where the displacement results are to be extracted. For the single-system pushover analysis, the control nodes can be selected at the center of mass of rigid floors/attic diaphragm, where also possible torsional effects are reflected in the 3D model (under torsional irregularity limitation of 20% eccentricity).
The uppermost control point at the attic level or roof level (for flat roofs) reflects the top displacement of the model (the roof height has to be taken at the level of the highest level of a heavy mass diaphragm such as the level of an attic floor; not the pitch of the lightweight roof of a typical residential building (NPR9998:2018 G.4.3 (2)).
Control points at various floor levels should be added to investigate the behaviors at different stories. This gives also a better overview about which one is the failing level of the building for each load case and is also of used to estimate the effective mass participation for the load case (estimated from the elastic displacement at each level).
An example of choosing the control nodes in the the single-system NLPO is shown in the figure underneath. The presented model has rigid concrete floors. Node 678 and 2734 are the control node for both ±X and ±Y directions. The points in the figure below are located at the center of mass of each floor.
Note
In DIANA, after regenerating the mesh, the control nodes number may have been changed. Always check if the control points are the proper one!
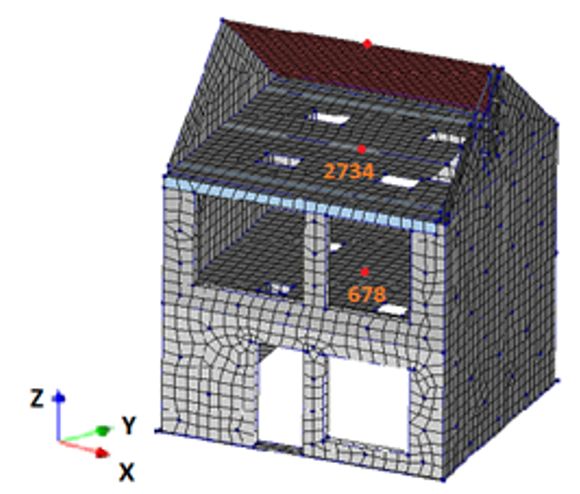
Figure 231 Positions of control nodes in single-system NLPO.
After running the analysis in DIANA (see Step A11 for SINGLE NLPO), the pushover curves (PO-curves) that describe the base shear force vs displacement of the structural system (at the control point) at each load steps are obtained (e.g.: figure below). To determine the base shear force for the building strength capacity, all the lateral reaction forces at the foundation are to be sum for each load step.
The critical capacity is decided after analyzing all computed PO curves both in X and Y (consult the how to guide: How_to_select_the_critical_pushover_curves-label ). One one curve is selected to further determine the “performance point”, but another may be checked also in case another global failure mechanism has been identified from the PO curves.
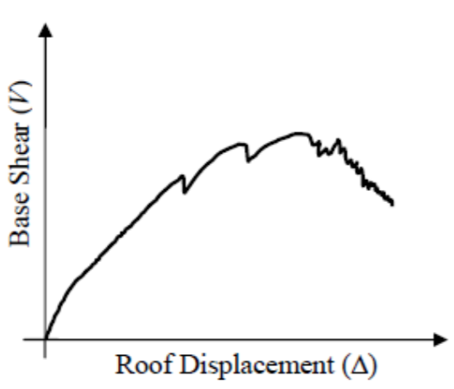
Figure 232 Example of a pushover curve.
Higher mode check
This check applies for the situation when the whole system is assumed as a SDOF system to conduct the NLPO assessment. Here, the T1 (first fundamental mode) with T1> 0.9 s, the mass participation factor for the mode should be higher than 60% (this check can be done only after the eigenvalues analysis) . This and other aspects are commented in the provisions of NPR9998:2018 G.4.8. In case T1< 60%, compute the eigenvalue analysis with flexibility (not fix) at the foundation level. If this is still not complying with the criteria. In case T1< 60% and T1< 0.9 s, a clear fundamental mode shape is desired if the modal load pattern is to be applied. Other load patterns different that the modal one may be also used.
Vertical irregularity and torsion check
Vertical irregularity check
All the criteria required to categorize a building as regular in the vertical plane (height) are described in the NPR9998:2018 4.2.3.3., below the main points are summarized.
All primary seismic element, such as structural walls, shall run without interruption from their foundation to the top of the building;
The lateral stiffness and the mass of each story remain constant or reduce gradually;
For framed buildings, the ratio of the resistance between story’s is not allowed to vary disproportionately between adjacent story’s.
Maximum height recommended for the NLPO analysis according to the NPR9998:2018 is of 4 stories (the attic may be considered as one upper story).
Structural lateral capacity system changes in between stories (for example a change of materials), except the roofs.
Torsion check
To perform this check an excel tool is available
(link).and a
_viia_eccentricity_check() function is implemented in the viiapackage:
viia_eccentricity_check(project=project)
A roof or floor diaphragm are defined as being rigid if they are able to transmit effectively seismic loads in between structural components at different locations of the building. This is important since it usually provide redundancy to the structure, but it has the downside that the torsional effects due to the different allocation of the center of mass and center of stiffness may reduce significantly the actual capacity of the structure. An example of a rigid diaphragm is a roof or floor built by a concrete slab or concrete on metal decking. Rigid diaphragms are laterally supported by walls (or other lateral resisting element) which transfer the seismic forces down to the terrain.
To determine the center of stiffness, the location and stiffness value of each seismic structural component should be determined. For instance in a cantilever shear “fix-flex” wall subjected to lateral load will deflect “∆”, the stiffness considering both the flexural and shear deformations (as in the equation below) for a unitary lateral load can be calculated by:
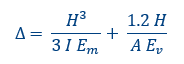
where A = t x L, I= (t L^3)/12 (un-cracked section), t = wall thickness and E_v = shear modulus = 0.4 E_m
After substituting the values presented above equation we can attain the following expression:
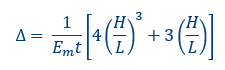
where the first component is the Flexural deformation component and the second one is the Shear deformation component. It is important to note that whether flexural deformation governs, or shear deformation governs, is dependent on the H/L ratio. Similarly to the cantilever, the equation for the “fix-fix” wall condition can be easily attain.
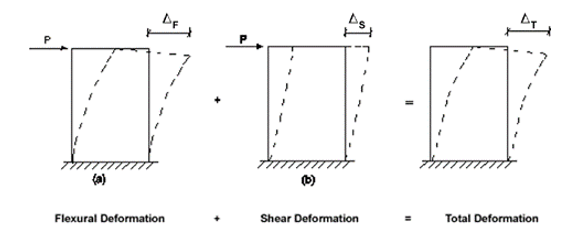
Figure - Modes of Deformation [reference: Engineering Notes for Design with Concrete Block Masonry, Concrete masonry association. Summer 2002]
The stiffness calculation option taking into account the fix condition at the top of the walls is as well available in the VIIA function. Openings in walls should be taken into account. Openings will reduce the cross-sectional area and the deflection will increase proportionally as opening sizes increase. On the other hand, to model walls with no spandrel elements may be an oversimplification of the model that is potentially reducing considerably the stiffness of walls; hence, an inappropriate condition to evaluate possible torsion effects that may occurs to the structure.
The rigidity of each wall is used to determine the center of rigidity. Here, a common simplification is to assume that when the applied loads act perpendicular to the wall the stiffness is assumed to have zero rigidity. The center of rigidity is then calculated as:
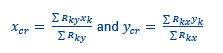
It is recommended to set an origin (0,0) in the lower left corner of the building. To find the center of mass, all the elements of weight that is tributary to the diaphragm are determined (both structural and non-structural). The seismic mass of the floors should be computed as described in the starting point document. The center of mass is then calculated as:
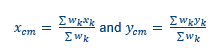
Torsion occurs when the center of mass and the center of stiffness are not aligned since the seismic shear force, V, acts in the center of mass (see figure below), and the resistance to this action is coming from the center of stiffness. The shear walls are to resist the torsion, as shown in the figure below; hence, applying an additional load on the walls. Note that the torsion plus direct shear of figure (b) and (c) below are statically equivalent to the figure (a) underneath. This additional load may be considered to reduce the lateral capacity of the building and should be considered in methods such as SLaMA to conduct the NLPO analysis. In the protocol, the 3D model type d NLPO is performed. Here, the effect of additional load reduction due to torsion is intrinsically include from the model.
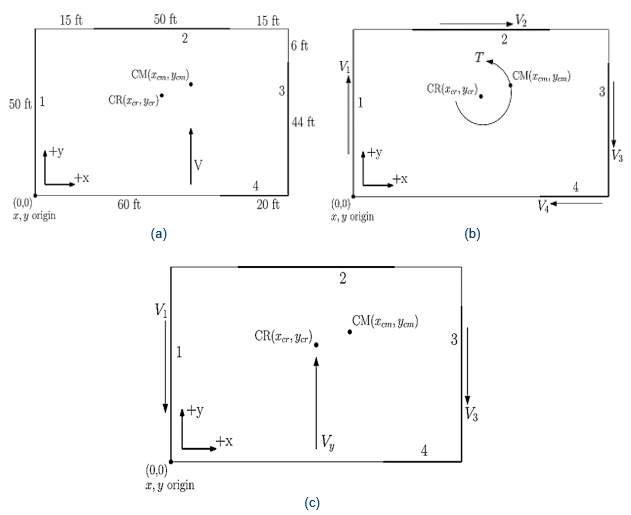
Figure - (a) Example of a building plan with shear walls and shear force acting in the C.M., (b)Torsion about the CR, (c) Direct Shear Acting Through C.R.
Nevertheless the torsion additional load is considered directly in a 3D analysis type, there are NPR9998:2018 torsion limitations that should be observed meanwhile conducting the NLPO analysis. These are expressed in terms of an eccentricity limits. The torsion induced on the diaphragm can be parametrized by the distance between the line of action of V and the C.R. This distance is called ‘eccentricity’. When V is acting in X then the eccentricity is e_y = y_cm - y_cr. When V is acting in Y then the eccentricity is e_x = y_cm - y_cr.
The eccentricity check consists of verifying that the eccentricity in any building direction is lower than 0.2 b, where b is the building shape dimension (width or length) in the orthogonal direction to the loading (Annex G, 4.9). The NLPO method is not applicable or require an additional spectral displacement demand (displacement increment according to MRS analysis NRP G.4.7) to be applied in case of:
eccentricity exceeds 0.2b but less than 0.4b (Significant eccentricity). In this case the procedure is described in Annex G.4.7 and the accidental eccentricity has to be calculated: e_(a;i)=±0.05 x L_i
eccentricity exceeds 0.4b (Severe eccentricity). In this case is not possible to perform an NLPO calculation and MRS or NLTH is required as a verification or substitution of the NLPO analysis.
In case of this protocol, is it has been observed that to comply with the 5% of accidental eccentricity in a 3D model (NPR G.4.7), a straightforward manner is to increase the stiffness of specific components to artificially increase the eccentricity (also Note 2 of NPR G.4.7 mentions that if torsion is expected not to be of importance for the structure, it may be ignored). To increase stiffness is preferred to lower it to prevent avoiding brittle failure modes of the building elements. The stiffness change is preferred to the mass change since it fits better the uncertainty found in real cases. The stiffness of elements should be modified not by means of a geometry change but by a change in the material properties. In case of significant eccentricity, the seismic demand spectral displacement must be modified (amplified) as commented in section G.4.7, equation G8, based on the MRS analysis.