How to assess results
In the workflow several simplified calculations precede the NL seismic analysis. This is intended to ensure that the model is set-up correctly. It is important to check the calculations on a number of points. This section describes the general checks that apply to all calculations. The analysis specific checks will be addressed in the analysis steps within the workflow.
To display analysis results of a calculation in the DIANA GUI, the correct dat and dpf (raw data model/model in DIANA with geometry) must be loaded together with the dnb files (the result files).
The table underneath indicates which outputs should be queried at which type of analysis. These items are the minimum required output in order to assess the correctness of the model. The final checks that are reported are described in How to check for compliance NLTH and How to check for compliance SBS.
Table - Assessments per analysis |
|||||||||
|---|---|---|---|---|---|---|---|---|---|
Displacements |
A1 |
A2 |
A3 |
A4* |
A7 |
A10 |
A12 |
A13 |
A15 |
x |
x |
x |
x |
x |
x |
||||
x |
x |
x |
x |
x |
|||||
x |
|||||||||
x |
|||||||||
x |
|||||||||
x |
x |
||||||||
x |
x |
||||||||
x |
x |
||||||||
x |
x |
||||||||
x |
x |
||||||||
Accelerations |
A1 |
A2 |
A3 |
A4* |
A7 |
A10 |
A12 |
A13 |
A15 |
x |
x |
||||||||
Forces |
A1 |
A2 |
A3 |
A4* |
A7 |
A10 |
A12 |
A13 |
A15 |
x |
x |
x |
x |
x |
|||||
x |
x |
x |
|||||||
x |
x |
x |
x |
||||||
x |
x |
||||||||
Linearities |
A1 |
A2 |
A3 |
A4* |
A7 |
A10 |
A12 |
A13 |
A15 |
x |
x |
||||||||
Nonlinearities |
A1 |
A2 |
A3 |
A4* |
A7 |
A10 |
A12 |
A13 |
A15 |
x |
x |
||||||||
x |
x |
||||||||
x |
x |
x |
x |
||||||
x |
x |
||||||||
x |
x |
||||||||
Numerical |
A1 |
A2 |
A3 |
A4* |
A7 |
A10 |
A12 |
A13 |
A15 |
x |
x |
x |
x |
||||||
* For A4 no required checks, often there are no checkable results due to the few steps
|
|||||||||
Displacements
Absolute and relative displacements can be presented in DIANA. This is a primary output to assess whether a construction is well modelled. Relative displacements are set to be the displacements relative to a point on the foundation. These are also the absolute displacements when no soil-block is used. When a soil-block is used, the absolute displacements are relative to the base of the soil-block at -30m.
Displacements of the entire building
Check if the displacements are logical, can be explained and are not too big or too small.
Are the displacements of building parts proportional to each other?
Are the displacements at the foundation smaller than at the top of the building?
Is the building supported in the right location?
Making a movie of the building to each loading step gives insight into the behaviour of the construction. In addition, it is a good tool for detecting (modelling) errors.
Are the displacements in and out-of-plane still within the compliance values?
Displacements per type of material
The displacements of an entire building show the overall behaviour. In addition, the local behaviour must also be checked. Select elements for each material and assess them based on the questions below. Use the showOnly function for selecting. Do this for all different materials.
Are elements supported where they should be supported?
Do the displacements have the expected magnitude?
Check the displacements in x, y and z direction
If necessary, the deformation can be checked with a manual calculation (‘vergeet-mij-nietjes’).
Possible errors could be in the material properties, the mass or the local axes.
Spanning direction of floors
The location where the floors are supported have a major influence on the mass distribution and the lateral shearing behaviour of the building. Check whether the shape of the deflection is as expected and that the floors are supported in the right locations.
Supports of beams
The beams are modelled as line elements, making it difficult to see if there are errors in the model. Check whether the displacements at the beam ends are correct. You can also display the geometry with showOnly function with the local axes for those beams.
Displacements of interfaces
Nonlinear interfaces are modelled with a force-displacement diagram. Usually without a maximum displacement. Check whether the displacements are not larger than the size of the support, and that the shallow foundation does not move any further than specified in the Excel sheet of geotechnical engineer, see example in the figure underneath (this is the Excel sheet with object specific data of the shallow foundation). In consultation with the geotechnical adviser it can also be decided if an exceedance is acceptable and/or if redistribution is possible. Note that there is a chance of numerical instability at interfaces.
The displacements of the shallow foundation under static load must correspond to the mass distribution of the object. The interfaces should be checked for the dimensions of the physical support.
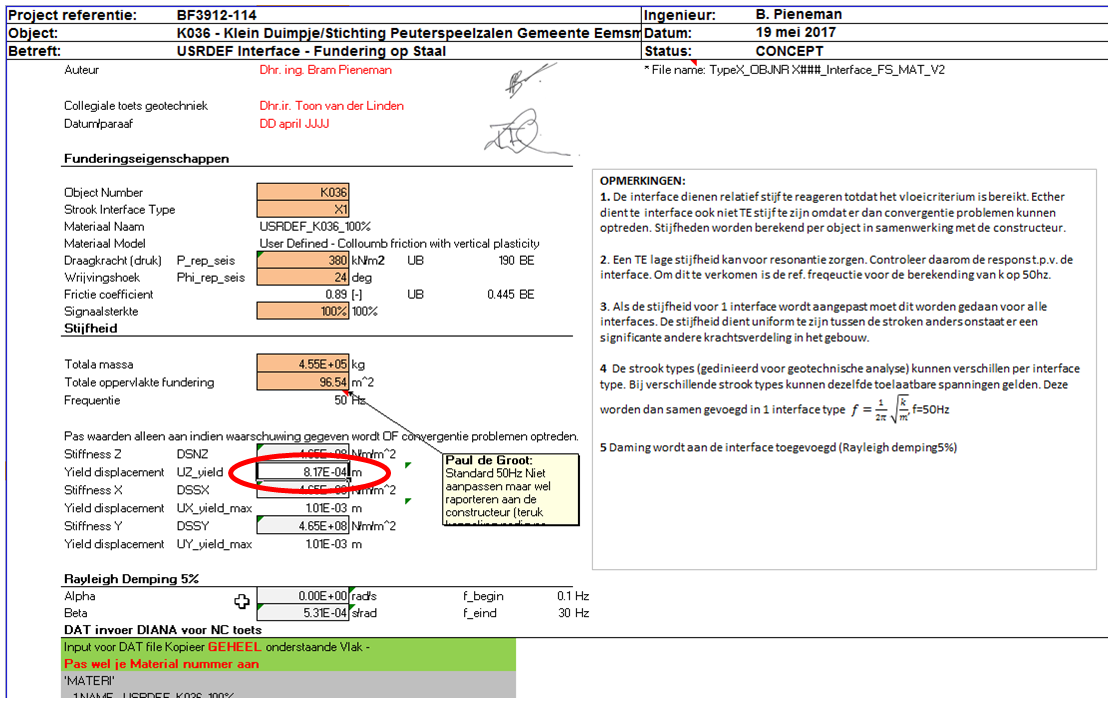
Figure 87 Figure Maximum displacement of shallow foundation, specified by the geotechnical adviser
DIANA only
If the calculation converges poorly or diverges, the displacements can be checked during the time signal. If the horizontal displacements become too large, the calculation may present problems. Then discuss this with the geotechnical adviser.
Connectivity between structural elements
To be added.
Movie of displacements
To be added.
Eigenmodes
The eigenfrequency graph and governing modes graphs are created in the result folder.
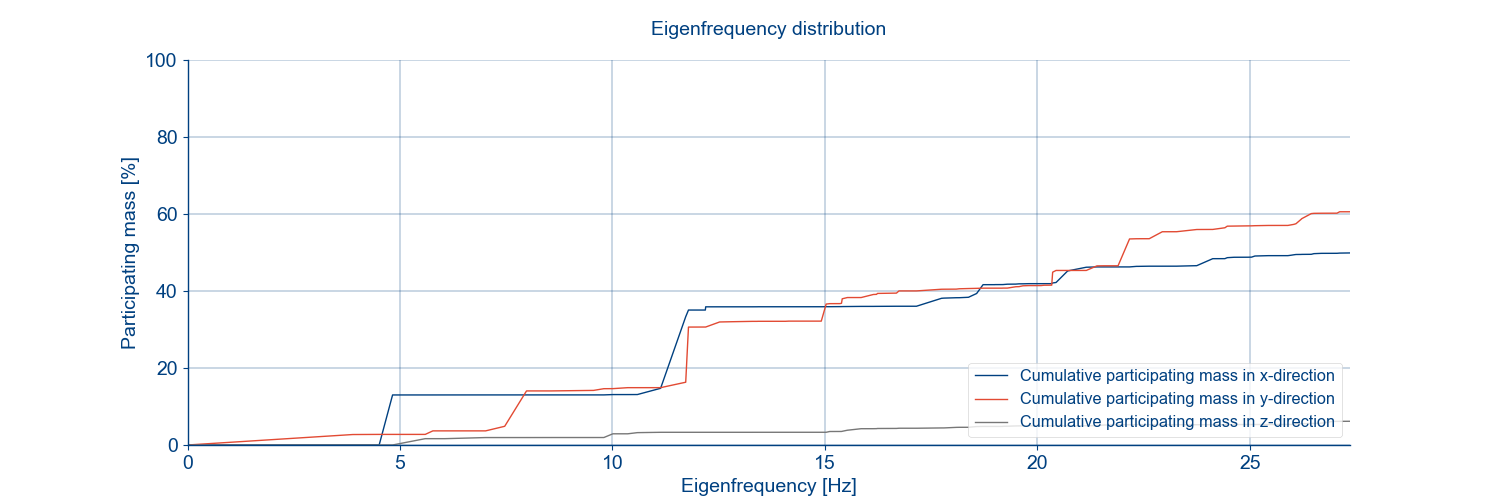
Figure 88 Example eigenfrequency graph.
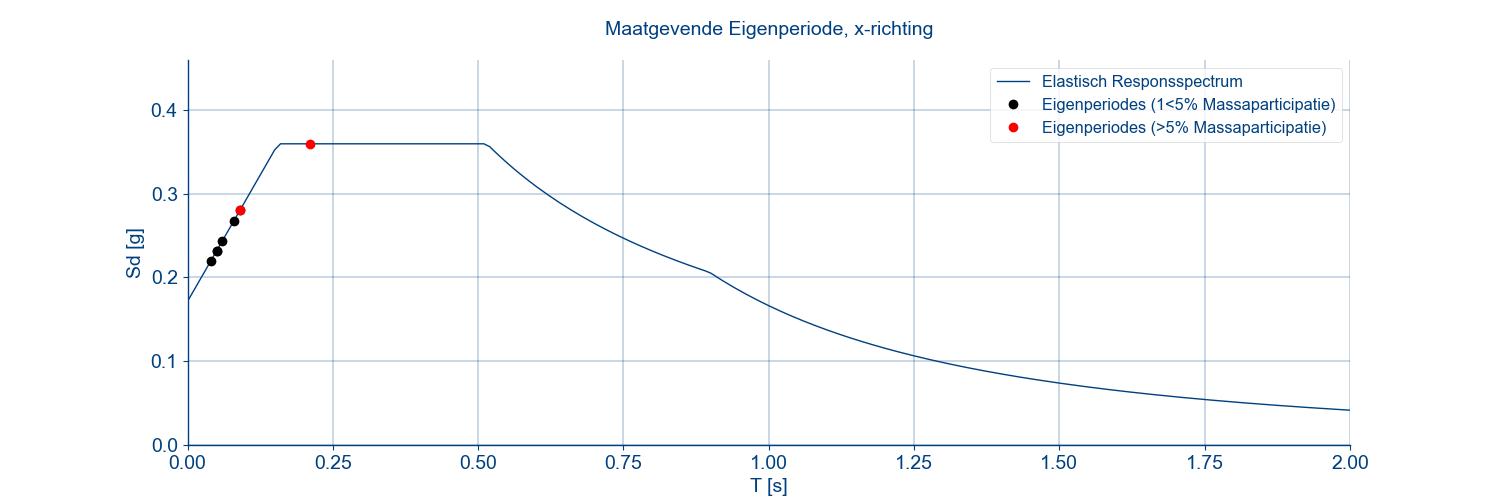
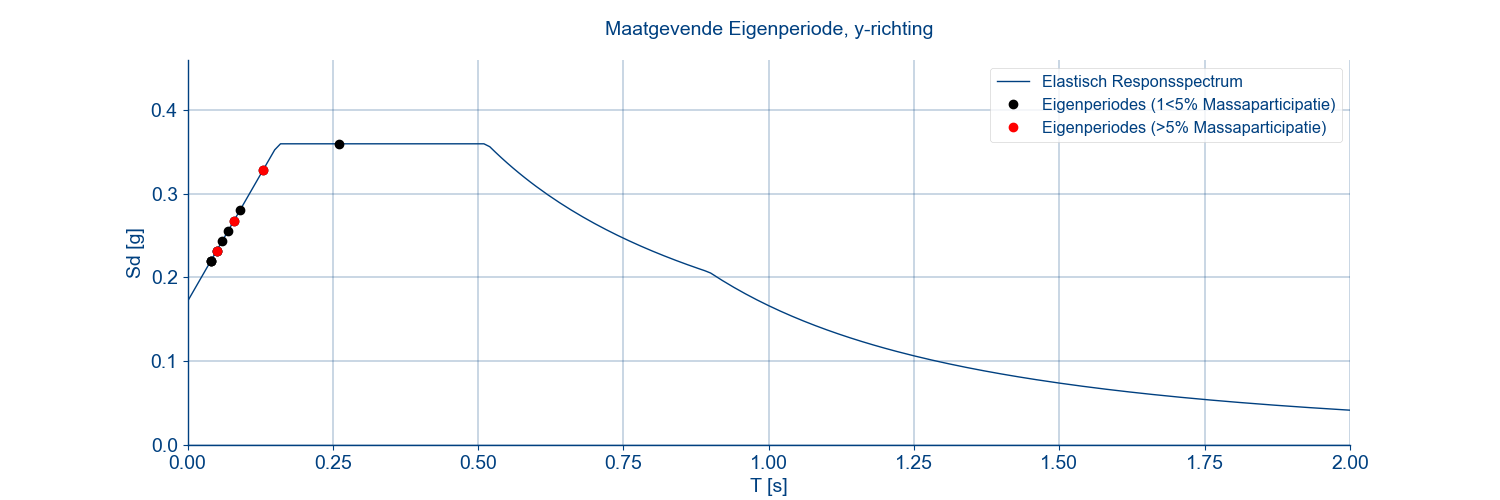
Figure 89 Examples governing modes graphs.
Check the result pictures and graphs created in the A3 or A7 folder. The following results can be checked by means of the previous function:
The elastic modal shapes (vibration modes) of the entire building (selection of fundamental mode for NLPO)
The elastic modal shapes (vibration modes) per type of material
The (wall) supports of beams and columns
Review carefully the vibrations of the first 30 natural frequencies, in x-, y-, z- and xyz direction. Usually here the main vibrations modes for the structure can be observed (the ones with larger mass participation). This provides insight about the buildings response to earthquakes and also is required step to assess if the building can be property reduced to a SDOF system for the NLPO procedure.
Inter storey drifts
To be added.
Wall out of plane displacement graphs
To be added.
Graphs op the displacements at reference nodes
To be added.
Accelerations (NLTH calculation)
In addition to displacements, accelerations provide insight into the behaviour of the structure. Large amplifications and imposed forces may occur.
Accelerations of building elements
DIANA converges with a certain margin of error. The remaining error in the calculation is included in the next step. This can be seen by showing the residual forces in that time step. For elements with a low self weight, this error can accumulate without causing a large residual force (see residual forces under the heading forces). You can see this error when the accelerations are requested.
Typical expected accelerations that are exerted on the building by the earthquake are between 0 and 20m/s2 for the Groningen region. For elements with a low self weight, or non-linearity, this can be up to 100m/s2. Larger accelerations indicate possible complications with these elements. You should always check the interfaces for these acceleration levels.
Acceleration graph
By default, in output 3 block,
viia_get_accel_graph_mesh_nodes() will select
one node on each floor, one for shallow foundation or pile foundation. After generating the output block, please check
your logging to see which node number has been selected for which floor/foundation shape. You can also change them by
using viia_modify_analysis(). Refer to MODIFY_DEFAULT_ANALYSIS-label for more
detailed description.
In the result handling the acceleration graph is created in the
viia_acceleration_graphs() function. It is
obtained by numerically differentiating the displacement results.
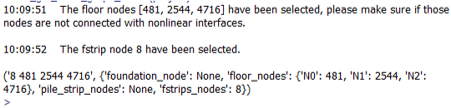
Figure 90 Logging indicating the default selected nodes.
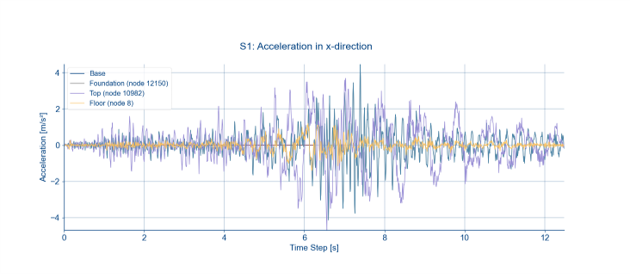
Figure 91 Example of generated acceleration graph.
The default setting for numerical differentiation can be changed by setting the numerical_differentiation input for
viia_acceleration_graphs() function as False.
This will plot the acceleration graphs directly from output 3 block.
If the graphs exhibit excessive noise as shown in the figure below, increasing the time step gap might yield smoother
graphs. This can be done by increasing the diff_gap value in the
viia_acceleration_graphs() function. It should
be noted that increasing the diff_gap value too much is not acceptable as it will result in the Nyquist frequency
falling below 25Hz.
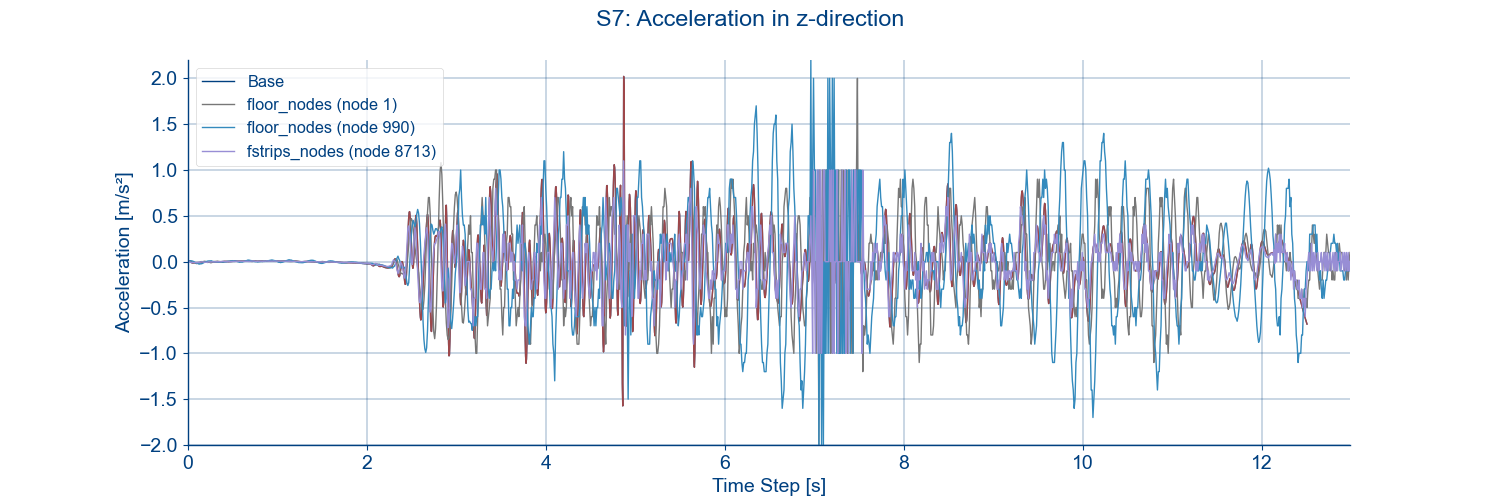
Figure 92 Example of acceleration graph with excessive noise.
Changing the diff_gap value to 2 for the above graph results in the following acceleration plot. It can be observed that excessive noise between 6.5s-7.5s is eliminated in this updated graph.
project.viia_acceleration_graphs(
    tb_file_loc=Path.cwd(),
    signal='S7', acceleration_nodes: [1, 990, 8713],
    numerical_differentiation=True,
    diff_gap=2)
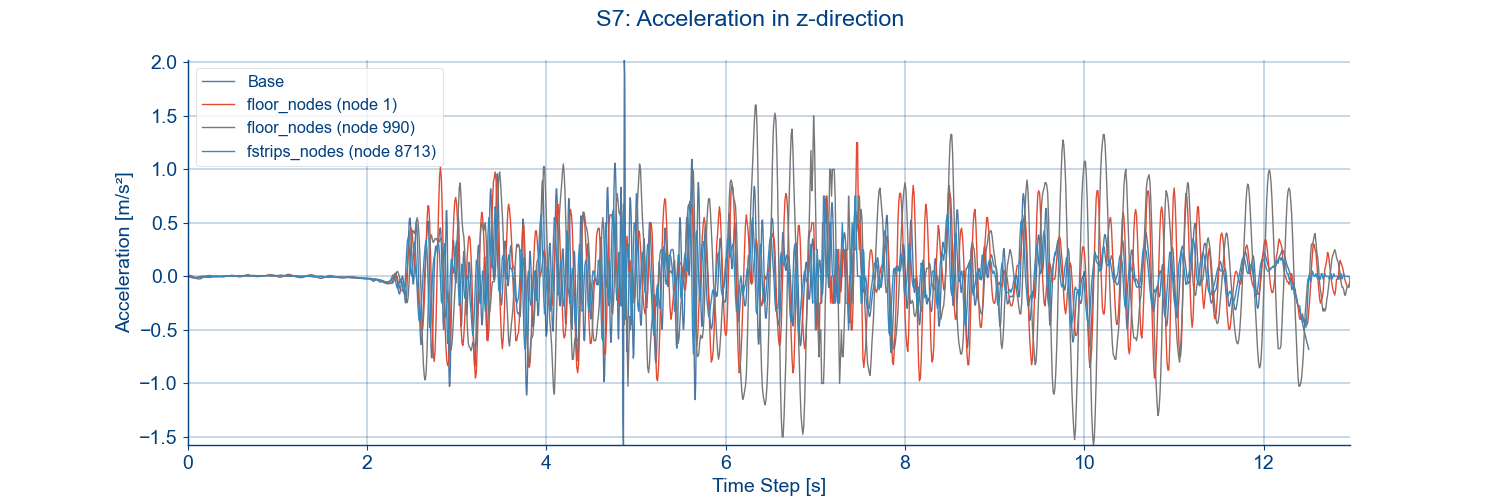
Figure 93 Example of updated acceleration graph with excessive noise in signal.
Forces
Linear elements are checked for forces or stresses. In addition, it is recommended to check whether the total external forces applied to the model are correct.
Residual forces (only DIANA)
The residual forces provide insight of the remaining out-of-balance forces. When showing the residual forces, the supports should be hidden, the residual forces that are shown at the locations of supports are the support reactions.
In elements that are in a nonlinear branch of their material model, larger residual forces are usually found. If there is a peak in residual forces somewhere in the model, this is usually of concern. Residual forces can increase considerably; when the values are not exceeding ~10kN there is probably no problem.
Resultant of the support reaction
The total load should be checked in the z direction. During the static situation this would have to be roughly in between 2-5kN/m3. In x and y direction this should be close 0 kN (also static situation).
Engineer tip: The total mass attained from DIANA can be checked with volumetric units observed from the VIIA engineering database. In average, masonry building with flexible floors weigh 0.33 tons per m3 and masonry with concrete floors weigh 0.43 tons per m3.
Compare total mass of the building to the A1 analysis
TO BE MADE
Resultant of the base shear per step
When calculations in the time domain are performed, there are all kinds of effects that may influence the loading process. At the support reactions, the base shear can be calculated at each step during either a fixed or flex-base analysis. For NLTH, results here should roughly in the magnitude of the reference acceleration multiplied by the building mass:
Figure 94 Add the soil column signals to the excel tool.
In NLPO, the base shear is dependent on the capacity of the structure only, so independent of the seismic demand (this is the pushover curve)
For a flex-base condition, stresses in the interface at the shallow foundation or the nodal forces in the piles need to be summed to derive the total base shear. The function viia_base_shear is available to calculate these forces for a shallow foundation. In the NLTH (with DIANA), for the piles the internal total nodal force of the upper node of the Huan beam should be used. The results can be read in an Excel tool that also graphically displays the base shear (LINK).
Linearities
In both a linear and non-linear analysis linear materials can be modelled. These should be checked.
Linear material stresses
To be added.
Non-linearities
The use of non-linearity is often the cause of numerical problems (the inability to find balance). Especially at abrupt transitions from high to low stiffness.
Cracking
The crack pattern gives a clear picture on the failure mechanisms of the building. Check whether the cracks are in a logical place (pattern), and whether they can be explained. Cracks that are a few millimeters indicate failure. Crack patterns can be classified according to type, as shown in the figure underneath. Excessive cracking in A10 analysis can suggest poor modeling assumptions or modeling errors.
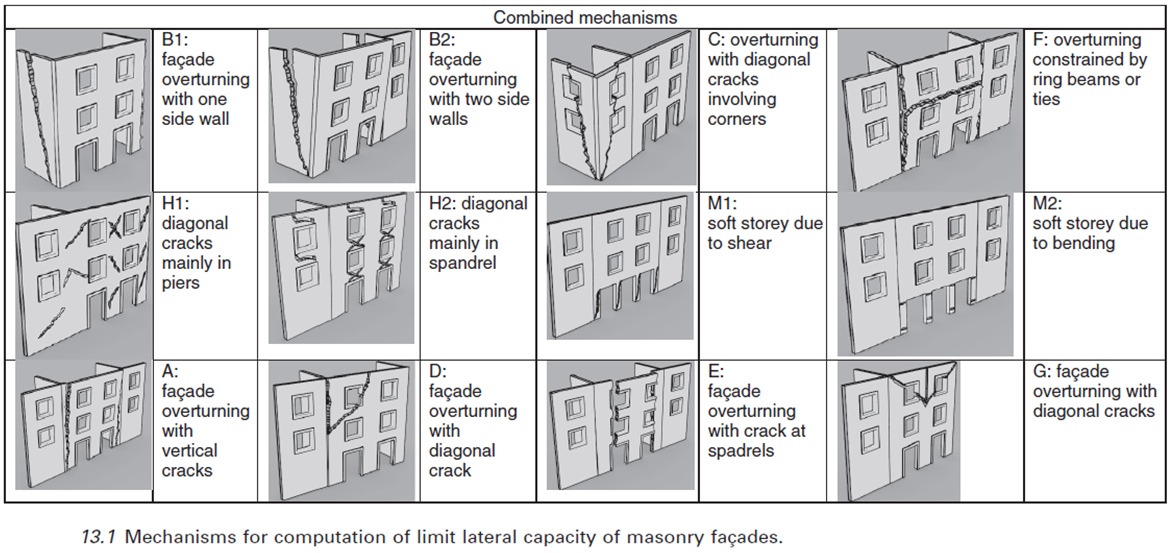
Figure 95 Out of plane failure mechanisms of masonry [source: Assessing the seismic vulnerability of masonry buildings, fig 13.1, D.D ‘Ayala, University College London, UK, 2013]
Note that the crack-width in DIANA and ABAQUS is related to the element size (a smeared crack model is used). This means that the deformations caused by crack formation over the height of the element are calculated as a percentage. This may actually mean that two cracks have occurred or one large one. That is why crack-width can not be used as a compliance criterion, and only for insight into the behaviour (for example failure mechanism).
Interface stresses (tractions)
With nonlinear interfaces, it is important that tension and compression are defined in the right direction. Check the displacements and forces that occur in the interfaces. This can be a reason why a calculation is not converging and/or has strange results.
Tension in shallow foundation interface (only DIANA)
In the interface of the shallow foundation a maximum compressive stress is defined. When that stress is reached, the foundation must redistribute the forces. When the compression limit is reached at different locations, this can lead to poor convergence of the calculation.
The maximum horizontal stresses depend on the normal force in the interface. If there is no compression, the maximum capacity in the horizontal direction can easily be exceeded.
Force in piles
Pile foundations are normally not designed to withstand large horizontal forces in Groningen. Especially for tall buildings, large horizontal forces will appear on the piles, and they will fail. Therefore the forces and displacements must be compared with the capacity determined by the geotechnical adviser.
Tensile stresses in the masonry
To be added.
Foundation
This section presents the results of the foundation analysis. The foundation model has been reviewed and aligned with both the lead engineer and the geotechnical advisor. The outcomes of the analysis should be verified to ensure they are consistent with the agreed-upon modelling assumptions and parameters.
Foundation behaviour report
A report can be generated in the analysis folder, which should be used to assess the foundation behaviour in the NLTH (Non-Linear Time History) analysis. The report generated is intended for internal use only and is not a client deliverable. It provides detailed insights into foundation performance and should be used to verify modelling assumptions and identify potential issues.
Verify that the foundation modelling aligns with agreements made with the lead engineer and geotechnical advisor.
Review the graphs and data in the report to confirm consistency with expected foundation behaviour.
Document any discrepancies or unexpected results and initiate follow-up analysis if needed.
Ensure that the report is used as part of the internal validation process before finalising the NLTH analysis.
This report is optional and can be generated by setting the foundation_behaviour_report parameter to True in the
viia_results() function used in the result script. Details on the functionality can
be found here:
viia_foundation_behaviour_report().
project.viia_results(analysis_nr=analysis_nr, signal=signal, foundation_behaviour_report=True)
Shallow Foundation Assessment During creation of the NLTH analysis, output data for randomly selected reference elements (OUTPUT_GEO_REF) is automatically included. These results are used in this report to generate:
Graphs of the relationship between time, stress, and relative displacement for each reference element:
Time vs. Stress (interface tractions)
Time vs. Relative Displacement (interface strains)
Stress vs. Relative Displacement
Values are averaged over the integration points of each reference element.
Review the graphs included in the report to assess the dynamic response and consistency with expected behaviour.
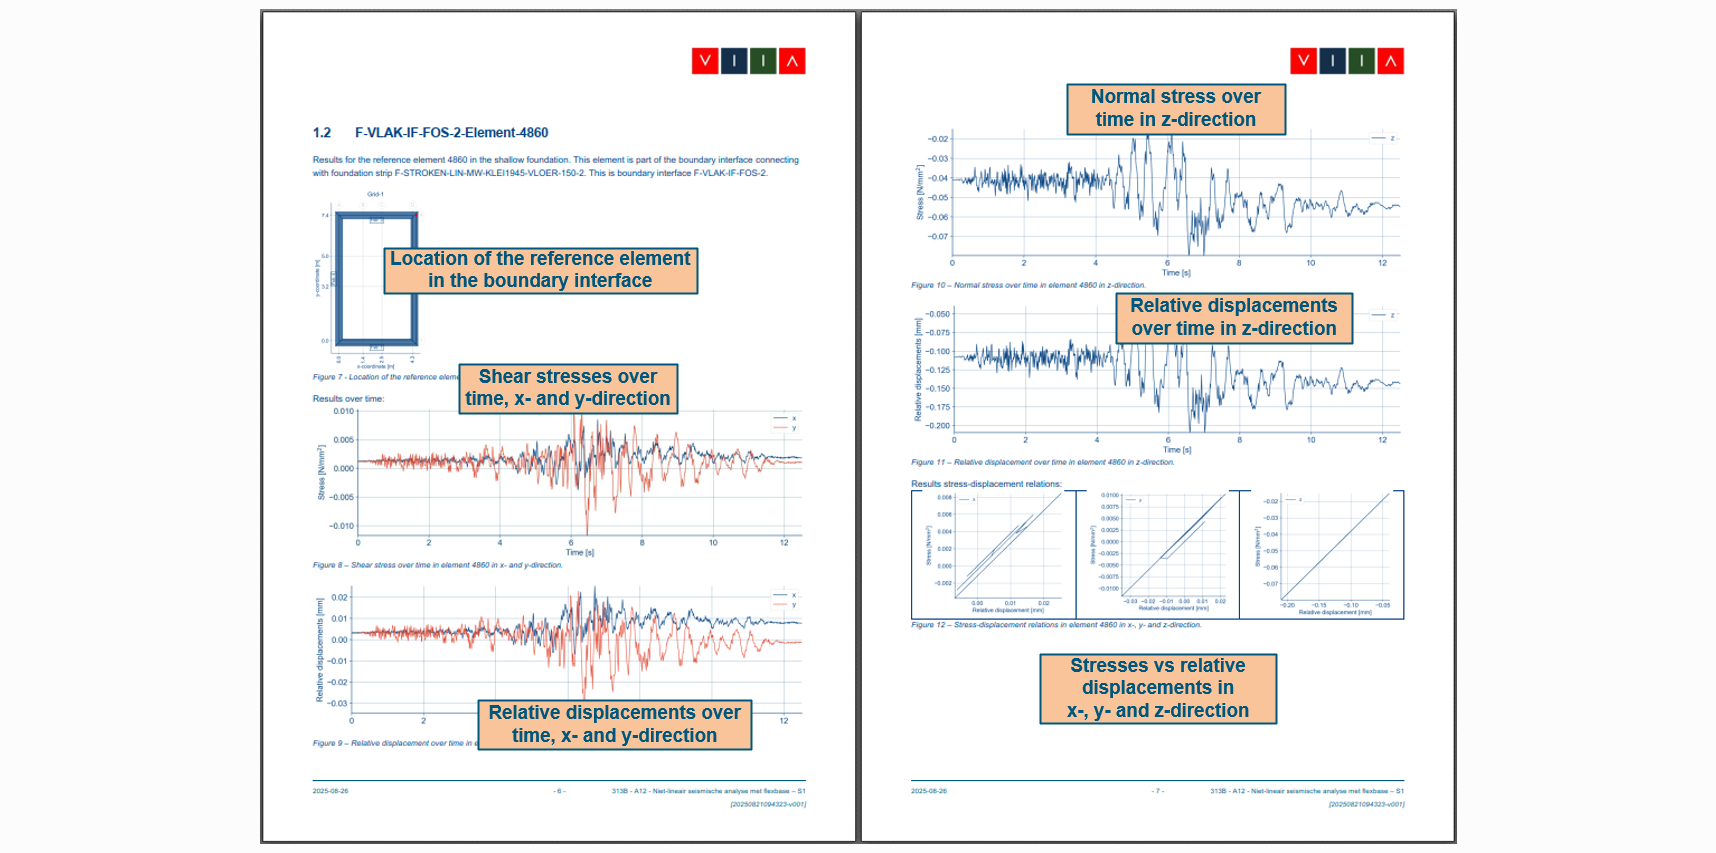
Figure 96 Example part of report for the behaviour of the shallow foundation at the location of the reference element.
Pile Foundation Assessment For pile foundations, timestep results are collected in (OUTPUT_5B).
The report includes per-pile graphs showing:
Time vs. Reaction Force (nodal forces of the top-node of the pile shape)
Time vs. Relative Displacement (calculated difference of the displacements of the spring elements at the top of the pile shape)
Reaction Force vs. Relative Displacement
Use these graphs to evaluate pile performance under dynamic loading and verify alignment with design assumptions.
Figure 97 Example part of report for behaviour of pile in foundation.
Interfaces
This section presents the results of the interface connection analysis.
Shear force report
When applying strengthening measures for connections between structural elements, the UO-phase requires detailed forces for the final design of the strengthening measure. This report that can be generated for A15 analysis (NLTH with L2 strengthening measures) provides the shear and normal forces in linear line interfaces used in the structural analysis. The report supports the assessment of strengthening measures and existing interface behaviour.
The report provides detailed insights into shear forces in linear line interfaces used for L2 strengthening measures.
Optionally, the engineer can choose to include existing line interfaces that use a linear elastic material model, to assess the behaviour and the forces acting in those.
This report is optional and can be generated by setting the shear_forces_report parameter to True in the
viia_results() function used in the result script. Details on the functionality can
be found here:
viia_shear_forces_report().
project.viia_results(analysis_nr=analysis_nr, signal=signal, foundation_behaviour_report=True)
The report is not a client deliverable. It is intended for internal engineering validation and should be used to support decision-making during the analysis phase. The data is to be used by the detail engineer active in the UO-phase.
Numerical
Iterations are required for most calculations in an NLTH process. The reliability of the outcome depends on the achieved convergence and the iteration method.
Convergence behaviour (only DIANA)
When there are several non-linearities in a model, it is difficult for DIANA to meet the convergence criteria in every step. Check the number of steps in the .out-file where the convergence criterion is not met. If the error is bigger than 1.0E-01 then the solution is probably no longer reliable. Also check the steps where the error lies around the 1.0E-02, or where several steps do not converge in succession (certainly with increasing values of exceedance). If the results can be explained, the solution can be assumed to be correct.
Use can also be made of the analysis tool to show the convergence behaviour (MOVED TO SHAREPOINT). This plot is also included in occasions in the engineering report. Also a function is available to create this plot: viiaAnalyseOutFile.
Energy balance (only ABAQUS)
How to check energy balance refer Energy balance.