For NLTH, the output is collected from nonlinear static analysis of the model (A10/A13), combined with the results of
the nonlinear time-history analysis (A12/A15). Before sending, these two results are combined in one file which is
required to be sent to the geotechnical advisor.
Note
For NLTH, if your object requires no strengthening (only the BSC phase is performed), then running the
geo-output functions with the A10 calculation result files in combination with the A12 calculation result files is
sufficient. If your object does require strengthening, then A10 and A13 calculations files in combination with A15
calculation result files are needed. In case of strengthening, make sure that version of at least 2 is set for A13
and A15 calculation result files.
If there is no strengthening in the model, following are the steps:
Behind the scene, the package will process the stress data collected for foundation strip element in 5A.tb and the force
data collected for pile element in 5B.tb in vertical direction. It will sum up all the force for each foundation strip
and pile. Eventually, you will see the geo_output_nls.json written in the analysis folder.
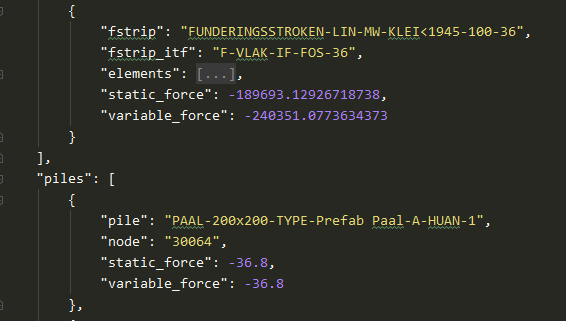
For each foundation strip, the corresponding boundary interface is linked, the total vertical force after static load,
variable load are stored as well as the element labels. While for piles, the pile node is recorded together with the
vertical force after static and variable load.
To create output for geo, you need to generate output request for ABAQUS, and this request can append to your
envelope_results.json from your A12 analysis. This can be done by running the function.
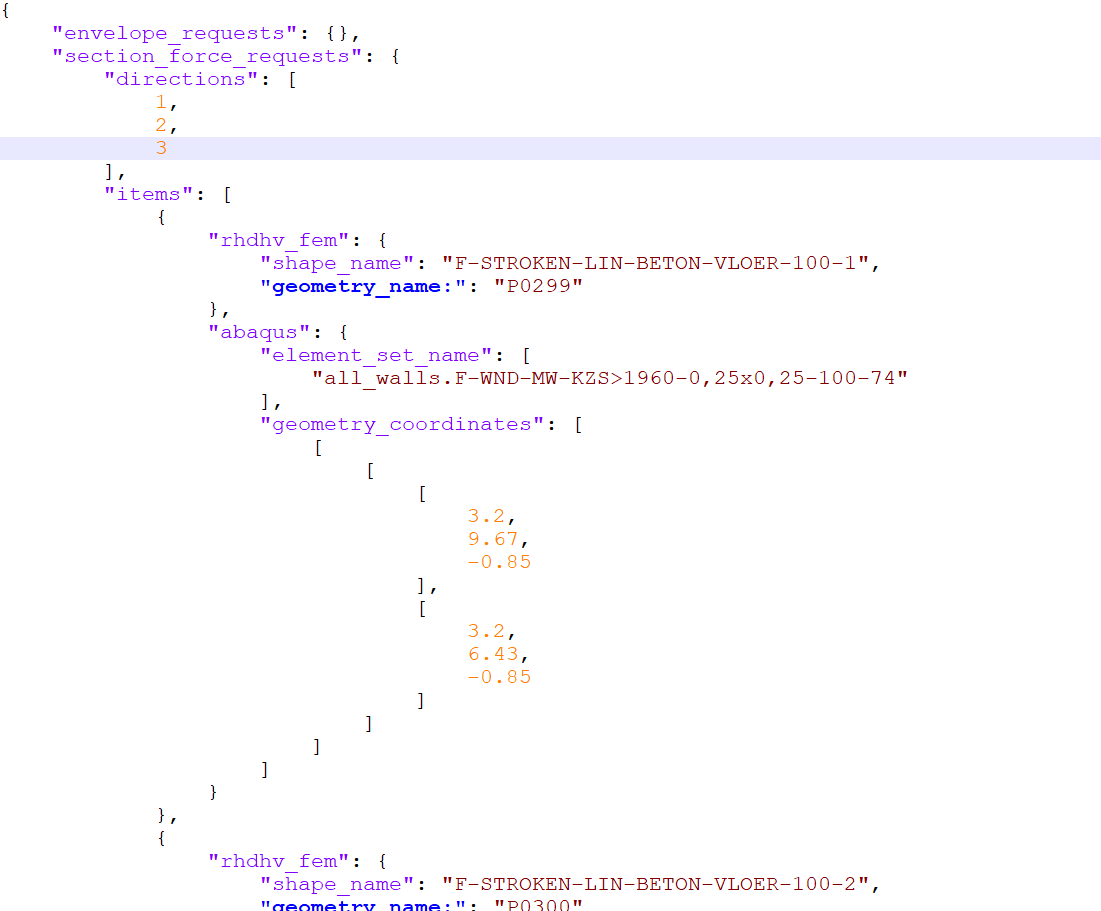
After running the function, you should be able to find the “section_force_requests” (and “displacement_request” if you
have piles) in your json. Additionally, to speed up the process, you can delete the text in “envelope_request” if you
have already finished your envelope results postprocessing for A12.
In the end, the envelope_results.json for geo output should look like this:
Figure 3 - ABAQUS envelope_results.json for gro output.
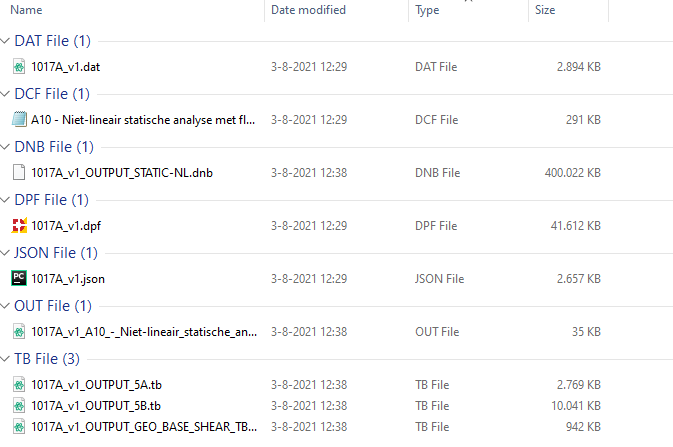
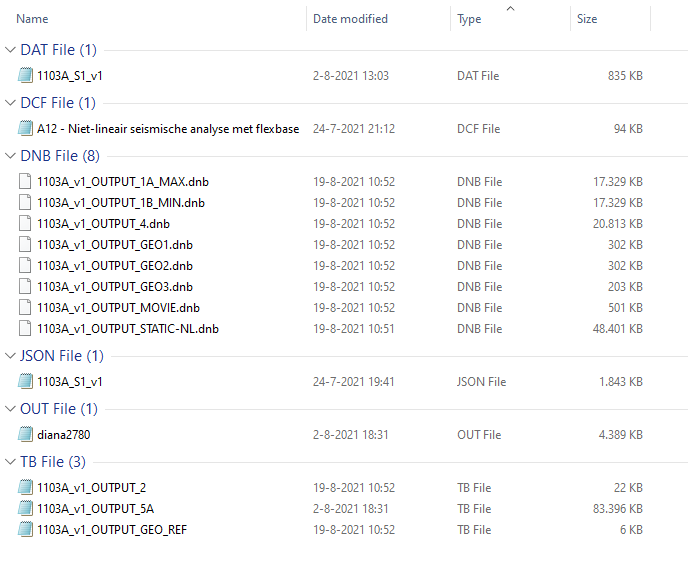
Then, after running A10 analysis on server, the following files should be available in your folder:
Then, copy the envelope_results.json you just created to the this folder. Also, check the postprocessing.bat by
right clicking and selecting edit, and make sure it calls your latest json. The content of batch should look like this:
Then run this batch file by double clicking. After it is finished, a new json file called
A10-Niet-lineair_statische_analyse_met_flexbase_postprocessed_data.json should appear in your folder.
Within this file, the section forces for each foundation strips in all directions are stored. While piles, the
relative displacements from pile top to bottom for each pile are also stored. You should copy this file from server to
the working folder in your laptop.
Once you have A10-Niet-lineair_statische_analyse_met_flexbase_postprocessed_data.json on your working folder, run
the function:
project.viia_create_geo_output_static_analysis(abaqus_results=Path(r"Cxxx\A10 - Non-linear static flex base\A10-Niet-lineair_statische_analyse_met_flexbase_postprocessed_data.json"),output_dir=Path(r"Cxxx"),foundation_type='strips')# or piles, mixed
Then you should have a new json generated called geo_output_nls.json. The file looks like this:
The most important attributes for the geo-output within the _viia_results() is the boolean
geo_output which should be set to True, the path variable bsc_nls_dir, which is the location of the A10 folder where
the geo_output_nls.json can be obtained for the BSC analysis. This folder location can be assigned manually. If not
assigned, then the latest analysis folder for A10 is selected for generating the .json file. The results from this .json
file is used to produce the final merged json-file.
Once these functions have run through, the GeoOuput folder is created in the working folder. Within this folder,
you would find either a fstrips folder or piles folder or both depending on the foundation type. The final
geo-output json-files can be found inside those. This needs to be done with each signal individually. The final
geo-output structure will be as shown in the figure below.
Figure 6 - Geo output structure in the working folder
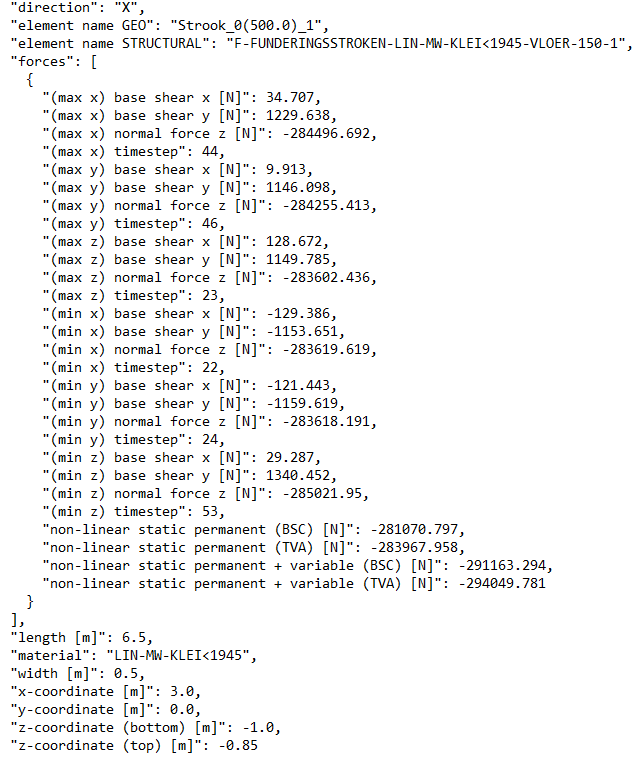
It is essential to do some checks on the geo output depending on your foundation type. In Figure 5 the geo output
for a single foundation fstrip element and Figure 6 shows the ge output for a single foundation pile element.
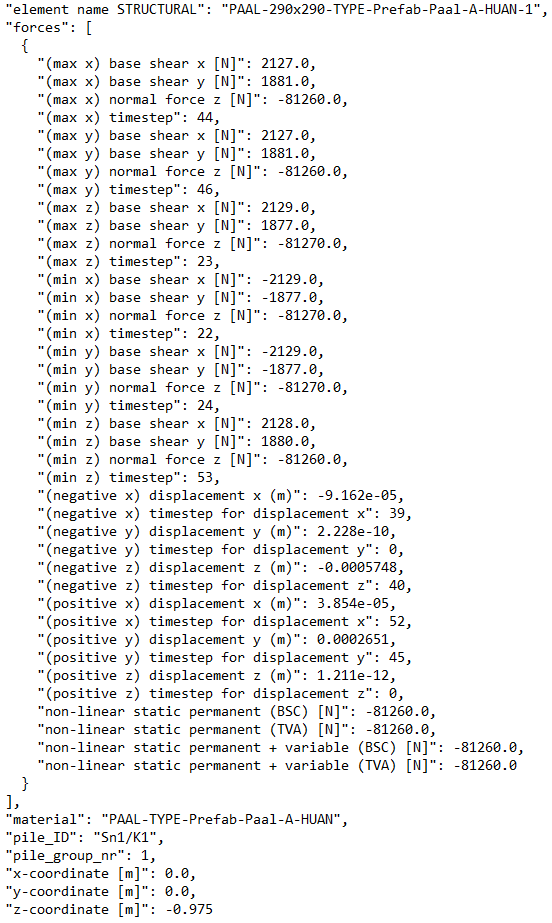
The generic check for both cases is the structure of the forces and displacement in case of pile foundation.The seismic
forces should have 24 rows with 6 situations (maximum and minimum for each global direction ) and the non-linear static
forces should have 4 rows. Additionally for pile foundation, the displacement should have 12 rows with 6 situations
(maximum and minimum for each global direction). Since there are no measures applied, there should be no differences
between the BSC and TVA A10 results in the merged .json.
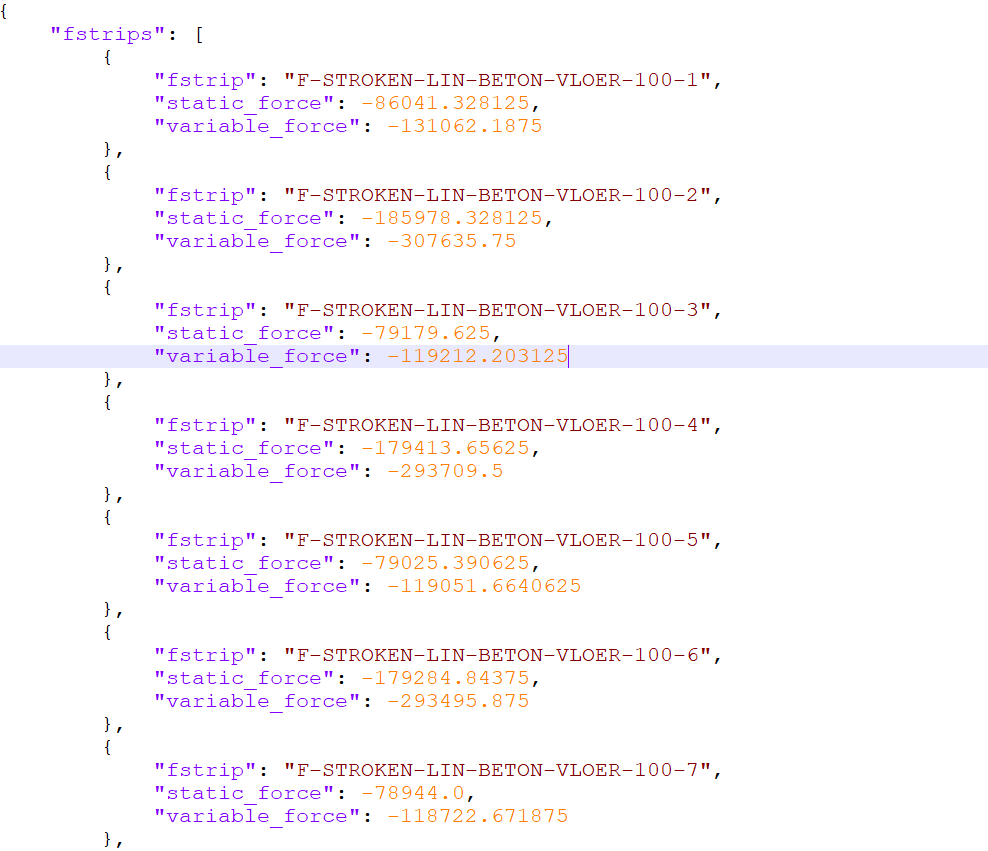
When the output is taken for fstrips, the parameters including direction, length, material,
width, coordinates (x, y, z_min, z_max) should be present.
Figure 7 - NLTH geo-output data for shallow foundations.
When the output is taken for piles, the parameters including material, pile ID, pile group,
coordinates (x, y, z) should be present.
Then run the batch file for every signal. After finished, a new json file called
A12-Niet-lineair_seismische_analyse_met_flexbase_postprocessed_data.json should appear in every signal’s folder.
Within this file, the section forces for each foundation strips in all directions are stored. While piles, the
relative displacements from pile top to bottom for each pile are also stored. You should copy this file from server to
the working folder in your laptop.
Once your have all A12-Niet-lineair_seismische_analyse_met_flexbase_postprocessed_data.json in your working folder,
run the function for every signal:
project.viia_create_geo_output_nlth(signal=signal_x,# for each signalbsc_nls_dir=Path(r"Cxxx"),# This should be the path of your geo_output_nls generated from A10abaqus_results=Path(r"Cxxx\Sx\A12-Niet-lineair_seismische_analyse_met_flexbase_postprocessed_data.json"))
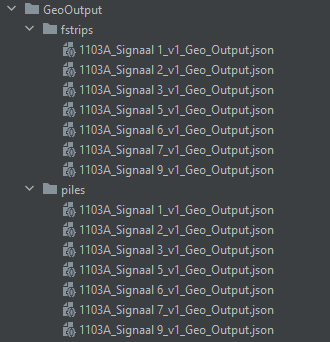
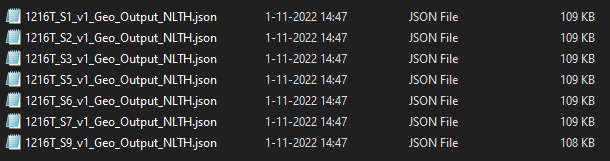
After finished all 7 of your signals, you should have a folder called GeoOutput in your working directory. Within
this folder, you should find the output foe geo like this:
Figure 9 - NLTH geo-output files for ABAQUS.
You can send these files to geo engineers. The data and format in this files are the same as DIANA geo output.
After running the analysis, the A13 folder should have the same files as that of the A10 folder (Figure 1).
Only the version of the files should be greater that 1.
Then, run the result functions for A10.
project=viia_create_project(project_name='xxx',analysis_type='NLTH',version_nr=2)project.current_analysis_folder=Path(r'Cxxx\A13 - Non-linear static flex base strengthening \20210803xxxxxx-v001')project.viia_results(analysis_nr='A13')
The resulting .json file in the A13 folder will have the same content as that from the .json generated in the A10 folder
(Figure 2).
After the A15 analyses are finished, the same files as A12 should be available in the A15 folder (Figure 5).
Only the version of the files should be greater that 1.
The most important attributes for the geo-output within the _viia_results() is the boolean
geo_output which should be set to True, the path variable bsc_nls_dir, which is the location of the A10 folder where
the geo_output_nls.json can be obtained for the BSC analysis, and if you have TVA analysis, then tva_nls_dir should
also be assigned, which is the location of the A13 folder where the geo_output_nls.json can be obtained for the TVA
analysis. These folder can be manually assigned in the result script. If not assigned, then the latest analysis files
from the A10 and A13 folders are respectively taken for the BSC and TVA analysis to generate the geo_output_nls .json
file. The results from these .json files are used to produce the final merged json-file.
Once these functions have run through, the GeoOuput folder is created similar to how it is described for the A12
Geo Output (Figure 6).
It is essential to do some checks on the geo output depending on your foundation type. These checks are the same as that
for the A12 Geo Output except for one essential difference in the first check. There should be differences between the
BSC and TVA results for the static analysis in the merged .json since these are taken for two different analyses. For
the rest the structures should be exactly the same as that for the A12 Geo Output (Figures 7 and 8 as reference).