Seismic analysis with SBS in VIIA
This page contains the protocol for SBS analyses. It extends on the NLTH part of the protocol.
Warning
This document is not updated for new developments as the SBS is currently not in the VIIA workflow.
What is SBS?
The Step-By-Step (SBS) approach is created to perform different analyses consecutively while the same modelling principles are used. First, the building is assessed based on a Modal Response Spectrum (MRS) analysis and the essential retrofitting measures are determined. If the retrofitting cost is lower than the cost limit, then the retrofit advice is completed. Else, a Non-Linear Time History (NLTH) analysis is performed focusing on minimising the MRS retrofitting measures. The cost limit is currently set to 50,000 ⬠including taxes and it applies to all buildings no matter the size, the structure type, etc. The purpose of this approach is to minimise the cost of retrofitting measures, using the two different analysis methods.
This approach provides an efficient workflow where both analyses can be performed with the minimal effort to transition from one to the other.
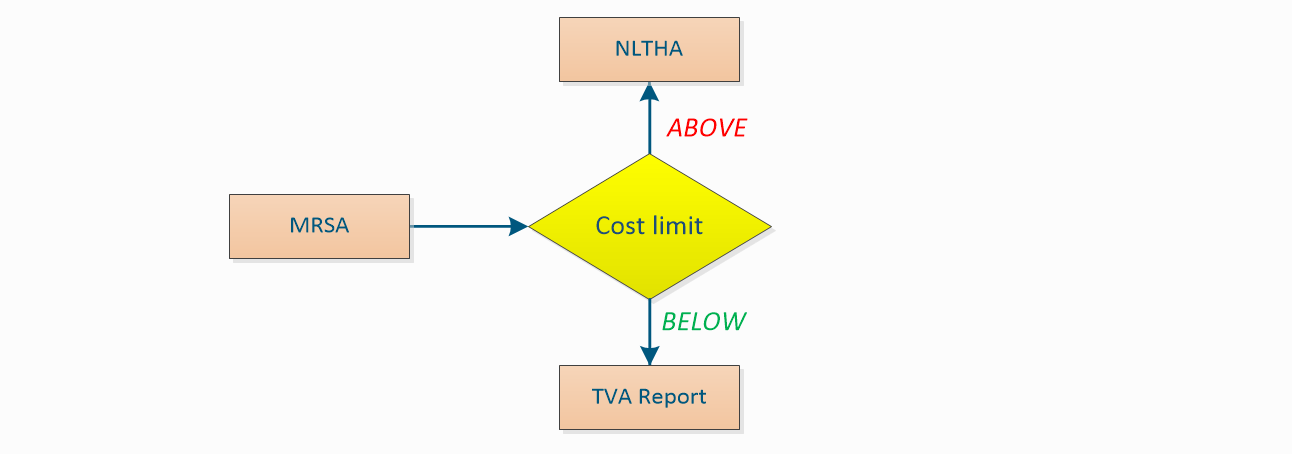
Figure 213 General workflow for the SBS approach using DIANA.
A modal response spectrum analysis is an analysis to estimate the structural response of short, nondeterministic, transient effects like earthquakes. It measures the contribution from each natural mode of vibration to indicate the likely maximum seismic response of an elastic structural model. It provides insight into the dynamic behaviour by measuring the pseudo-spectral acceleration, velocity, or displacement as a function of structural period and level of damping.
Within the MRS analysis, material properties remain linear (ductility is taken into account to reduce the seismic demand by the so-called behaviour q-factor). Seismic lateral forces, global X and Y, are applied to the structure according to the design inelastic response spectrum curve, where forces are derived from the seismic accelerations intensities observed against the eigen-periods of the structure. The forces magnitude applied on building elements to each eigen-periods is associated its participating mass and the modal shape. The minimum number of eigen-periods used in the calculation is up to the one to obtain a total cumulative participating superstructure mass of 90% or up to the cut-off eigenfrequency of 33 Hz. The results are given in terms of a combined modal output where the extreme forces and displacements are gathered.
For MRS in DIANA the following settings are specified:
For the modal superposition, the Complete Quadratic Combination (CQC) rule is used with 5% damping.
For the load superposition, the linear combination of the responses of the spectra is used. Only the horizontal spectra are considered, global X and Y. The load contribution factors 1 and 0.3 are chosen, see paragraph 4.3.3.5.1(3) of NEN-EN 1998-1. These factors are combined with the horizontal spectra for positive and negative directions resulting in eight different load combinations.
The static load is considered where the self-weight, the permanent loads and the imposed loads of the building are included.
A non-linear time history analysis is explained in section: What is NLTH?.
When to use the SBS method
The SBS approach can be used for any structural complexity. Itâs use limitation may be related to the quality of the available information (poor initial information may produce unreliable results), the available resources for the object (time and budget) or the structural system (if there are many 1D elements with no diaphragm action then many local eigenmodes occur which makes the MRS analysis slow). The use of the method may be also related to the requirements of the building owner and the structure importance.
SBS combines both MRS and NLTH analyses aiming to minimize the cost of the strengthening measures. The advantages and disadvantages of the two analyses are explained in section: When to use the NLTH method.
Generally speaking, this approach should be used when the expected amount of measures from experience cannot be estimated or it is close to the initial cost limit, see section: WhatIsSBS-label.
Phase 3 - Flexbase model Phase
Step 11a: Detailing
Text to be provided by Evangelos Goulas December 2021. For detailing in NLTH see Step 11: Modelling of strengthening measures.
Step M1: Model pictures
See the info on this step here: StepM1-label.
Step C2: Model check
See the info on this step here: Step C2: Model check.
Step A1a: Linear static analysis (geo-output)
In this analysis the overburden load per wall and the geo-output for shallow- and/or pile foundations is be gathered. With the overburden load, the in-plane behaviour of the walls is assessed after performing the A5 analysis. With the geo-output the existing situation of the foundation is assessed.
For the analysis related to the overburden load, the imposed loads are converted to self-weight. While for the analysis related to the geo-output, the imposed loads act separately.
To convert the imposed loads to self-weight, use the following function:
project.viia_convert_imposed_loads_to_self_weight()
Analysis
By means of the following function, a linear static calculation is created.
project.viia_analysis(analysis_nr='A1a', run=True)
Issues
For a better understanding of the dcf-file, read the how-to guide: How to DCF settings.
Results
For the SBS approach the following function collects the average overburden loads per wall in an excel-file:
project.viia_find_wall_overburden_load(
    walls=project.collections.walls, load_case=project.collections.load_cases[0], steps=50, view=None)
For the geo-output, after running the analysis, a tabulated file is created with the name object_name_OUTPUT_5A (for shallow foundations) and/or object_name_OUTPUT_5B (for pile foundations). These files contain the vertical load values per foundation element. It will be used later to create the geo-output in A5 analysis.
Step A3: Eigenfrequency analysis
In the MRS analysis, force magnitude is calculated from the site design spectrum according to each eigenmodes of the structure. Then, the forces are applied according to the elastic modal shape and the mass participation factor of each eigenmode. The total load on the structural elements is equal to the sum of all evaluated eigen modes. The usual minimum number of requested eigenmodes in the analysis is the one to attain 90% of the total mass participation, see NPR9998:2020 art. 4.3.4.3.1. This necessary mass participation is recommended to be estimated using only the superstructure mass assuming that the foundation does not contribute significantly especially with fixed base boundary conditions.
To calculate the superstructure mass of the building, you can follow these steps:
Be sure that your model contains the latest modifications and it is valid.
Run the A1 analysis to get the total mass, m_total.
Using the same model, delete the entire superstructure. In your model, you should see only the foundation elements (strips, piles, walls, etc.). Perform a linear static analysis and get the mass of the foundation, m_foundation.
Compute the mass of the superstructure, m_superstructure=m_total-m_foundation.
The required mass participation of the superstructure can be computed:
m_(final,superstructure)=90%*m_superstructureâm_total .
Run an analysis with at least 500 eigenmodes and check if the required mass participation of the superstructure is reached for both x- and y-direction. If not, increase the number of eigenmodes accordingly and check again. Through this iterative process you should be able to get one eigenmode in which both directions activate the required mass participation of the superstructure. This eigenmode will be used when the model response spectrum (A5) analysis is created, and it ensures that the 90% of the superstructure is activated.
If the number of eigenmodes becomes very large, several thousands, it will result in long computation time during the MRS analysis. Therefore, use the 33 Hz as a cut off eigenfrequency. After this limit the building acts rigidly so there is no significant added value. However, the missing activated mass should be converted into base shear and added to the geo-output manually.
Step A5: Modal Response Spectrum analysis
Warning
The modal response spectrum analysis is not available for ABAQUS.
A modal response spectrum (MRS) analysis with fixed base boundary conditions can be performed in DIANA to check all the structural elements. The only check which is not possible is the out-of-plane check of the walls. To perform a MRS analysis the following steps should be followed:
Perform eigenfrequency analysis first based on fixed base model and find the eigenmode with 90% of the superstructure or 33 Hz eigenfrequency (see Step A3: Fixed base eigenfrequency analysis).
Create the analysis according to the procedure in the how-to guide: How to MRS analysis.
Show in results the ‘superposition type CQC’ and perform the checks based on section ‘Compliance Check Criteria’ from Basis of Design SBS.
For the check of the walls the average overburden load is needed. Therefore, run a linear static analysis and gather the average overburden load for each wall. Before starting the in-plane assessment of masonry walls, consult your lead engineer to decide what is the best compliance method to be followed.
Analysis
Using the function viia_analysis(), a modal response spectrum analysis can be
applied to the structure with the predefined set output-items. The preferred setting for the run argument of the
function is ‘True’, indicating direct calculation in DIANA. The number of eigenmodes should have been derived in
advance following the instruction in section Step A3: Fixed base eigenfrequency analysis, see Step A3: Eigenfrequency analysis (optional).
The analysis is created with:
project.viia_analysis(analysis_nr='A5', run=True, nmodes=22)
Issues
For a better understanding of the dcf-file, read the how-to guide: How to DCF settings.
Results
For the SBS approach, refer to the how-to guide: How to check for compliance SBS.
Explanations for L4-sheet will be added by Saeid Mahmoudimotlagh.
Reporting
The results and compliance checks should be reported in HowToReport_AppendixResultsAnalysis-label.
Phase 3 - Flexbase model phase
Note
The flexbase model phase can be skipped for SBS aproach.