How to determine the performance point & verification of NPR 9998:2018 compliance
As observed in figure 45 (reproduced again here from section 4), based on the spectral capacity curve for the building (pushover curve normalized by the seismic weight) and the site seismic demand, the compliance with the NPR can be determined. This is valid to analyze a whole building system or a part of the system (subsystem approach)
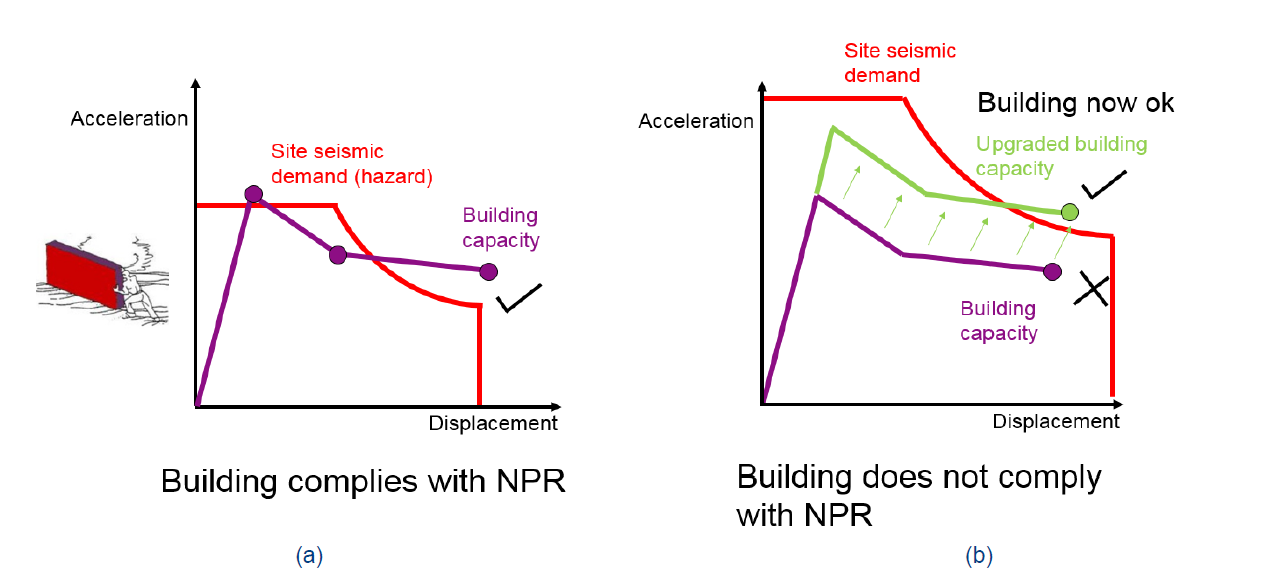
Figure - Phase 1 -In-Plane capacity of the building compliance check a) Complaint according the to 2018 NPR and b) not-compliant according to the 2018 NPR.
In addition to the compliance check, for compliant buildings the performance point “PP” should be determined. This is important because of the following:
Determine the load step of the analysis where to check the seismic actions on the elements of the building (process back from the ADRS to the structural model). For example, to check floor/connections and foundations.
Determine the expected displacements of the stories according to the seismic demand to assess the risk of pounding in between structures.
Avoid the risk of assessing structural components either over their maximum capacity after the elastic range (may affect the assessment of components not modelled nonlinearly such as connections and the foundations) or non-realistic displacements from the seismic demand. Note that spectral displacements for the assessment should not be over the maximum spectral displacements for the demand according to the corrected damping ratio. Remember that the drift limits were already be used for the determination of the spectral capacity of the building. The drift limits may be over the maximum elastic spectral displacement, just the EQ demand will not be capable, in that case, to push the building enough to reach that level of displacements related to the drift limit; hence, to assume the displacements for assessment at the drift limit may be too conservative, in particular for relatively flexible structures.
The envelope of compliant cases according to the capacity spectral “CS” method can be summarized in the figure B1, where 5 cases can be recognized according in function of the elastic and maximum inelastic allowed seismic demand (at 20% damping).
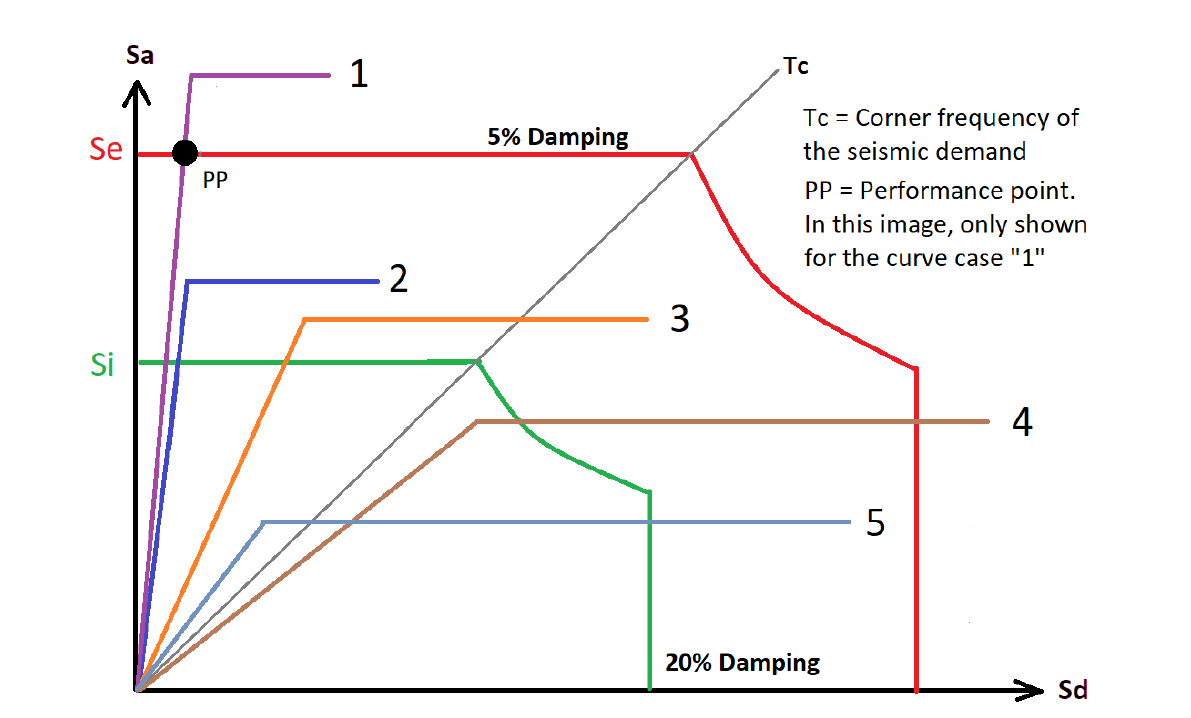
Figure - B1-ICS method compliant NPR bilinear curves. Note that the “PP” is only evident here for structure “1”.
The bilinear cases presented in figure B1 can be described as the follows:
Curve 1: The structure is performing in the elastic range. The PP can easily be attained by the intersection between the elastic demand and the bilinear capacity curve. Select the load step of analysis at PP (so this means that you go back from the ADRS to the structure in other to assess the structural elements).
Curve 2: The structure CS plateau is over the inelastic reference demand (ξ=20%) and below the elastic demand. Also, the spectral displacement is not reaching the corner frequency TC line. For this case, check if the minimum recommended ductility according to figure B2 is found. In case the minimum ductility is not reached, it’s recommended to describe the structure as non-compliant according to the EC8 and the object compliance to the NPR should be further discussed with the lead engineer. If this is not the case, determine the PP according to the modified iterative procedure explained in 8.1.
Curve 3: The structure plateau is over the inelastic reference demand (ξ=20%) and below the elastic demand. The spectral displacement is exceeding the corner frequency TC line. Determine the PP according to the modified iterative procedure explained in 8.1.
Curve 4: The structure CS intersects the inelastic demand in the constant spectral velocity section of the inelastic demand. Follow the procedure described in section 4.9.1 (stage 8 and stage 9) to determine the PP. Also reviewed in section 8.1.
Curve 5: The structure CS intersects is the inelastic demand in the constant spectral displacement section of the inelastic demand. Follow the procedure described in section 4.9.1 (stage 8 and stage 9) to determine the PP. Also reviewed in section 8.1.
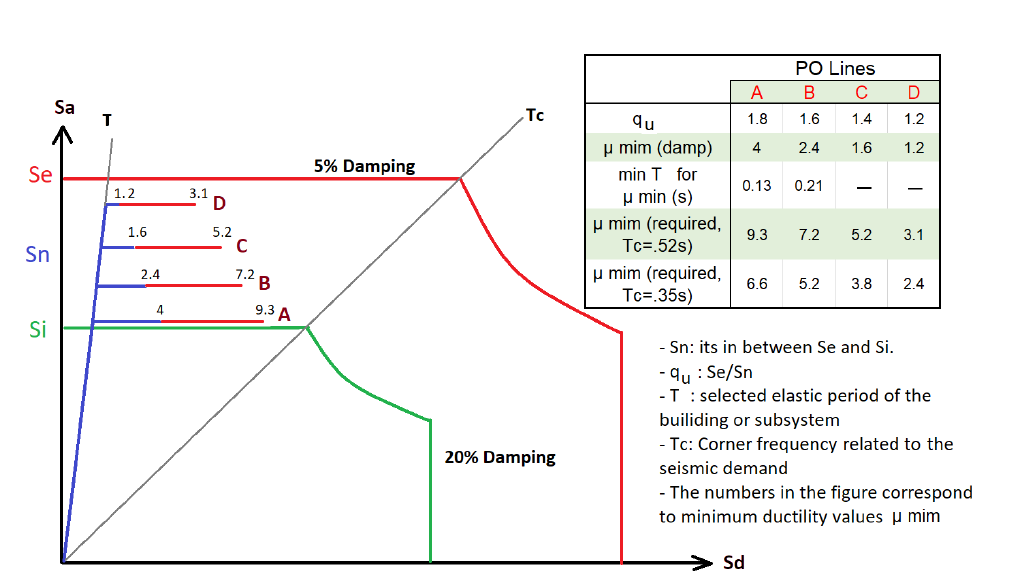
Figure - B2-Curve type 2 minimum ductility requirements according to the EC8 and not considering SSI radiation damping.
The values of minimum ductility associated with figure B2 are determined only from hysteretic damping (soil-structure interaction damping is not included). After the minimum ductility required is archived, the performance point is obtained by the modified iterative process as explained in section 8.1. If considered that the damping observed from the soil-structure is equal to 15% of the total damping (maximum allowed for soil damping), the structures presented in cases of curve 2 and curve 3 will perform in the elastic range, with intersection at the 20% damping level (15% soil damping assumed). This must be verified according to the NPR annex G.8.2 section formulations to determine the radiation damping.
Iterative process to determine the performance point ‘PP’
The iterative process to determine the PP described in the NPR 9998:2018 provision (section 4.9.1 of this protocol, mainly from stage 5 to stage 9) may be modified to include Curve 2 and Curve 3 cases. Here, the modification consists of a single aspect: a change of how to estimate the value of uint, since the CS bilinear curve is over the inelastic seismic demand plateau at the initial reference damping of 20%. It will be incorrect in these cases to consider the intersection of the CS curves with the plateau as the performance point; except when the damping is attained form the soil-foundation interaction formulations as commented previously.
In figure B3, the modified iterative process is shown graphically for both curve 2 and curve 3 cases. The intersections with the inelastic demand are calculated according to an initial effective period, related to the displacement at the end of the structure displacement capacity (for the case of 20% hysteretic damping, maximum μsys = 4). In the figure, u0 corresponds to the first displacement of the iteration and for case 2 curves its recommended to be over the μmin values estimated form figure B2. For curve 4 and curve 5, u0 corresponds to the direct intersection with the inelastic demand curve, as mentioned in the procedure described in section 4.9.1.
For the curve 2, when the damping is corrected it might happen that the plateau is now over the CS capacity. In that case, the new uint is found from the extended equivalent stiffness curve and the ductility will be increased (which will in turn reduce the inelastic demand). For curve 3, when the new inelastic plateau presents higher capacity than the CS bilinear curve, the new uint will be found at the intersection in between the inelastic demand and the CS. For all curves from 2 to curve 5 when a new ductility is calculated, it should be of a maximum of 4 in the equation, even if it is not observed at the uint. In this case, the previous inelastic damping demand at 20% can be used.
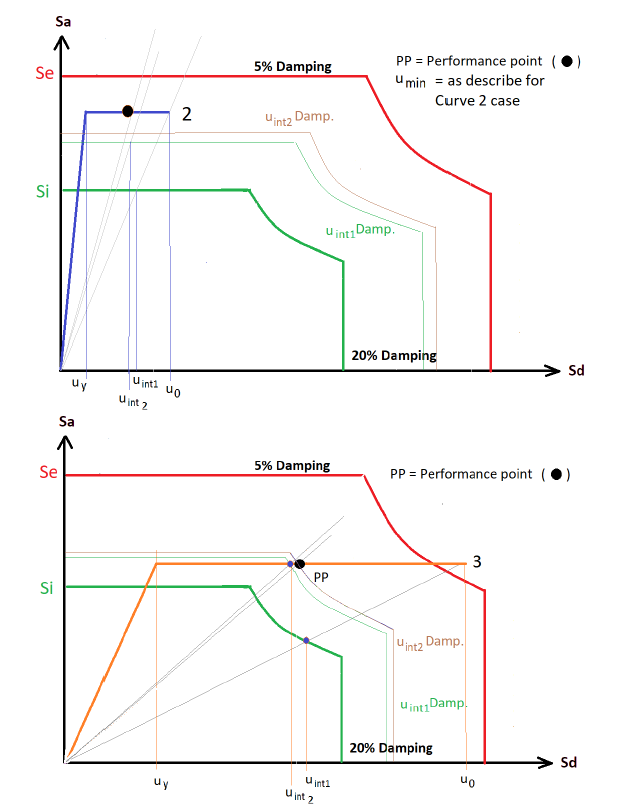
Figure - B3-Graphic iterative process to determine the performance point for curve type 2 and curve type 3 cases (usually the third iteration already present an accurate enough value as observed in the figures, (notice little change in the equivalent stiffness value)). In the image, usys is called u0 as it represents the first step of the process.
Additionally, for both curve 4 and curve 5 cases, if the intersection with the inelastic seismic demand corresponds to a uint greater than the one necessary for a ductility value of 4, then the intersection with the seismic demand corresponds directly to the performance point, this is the case of the blue curve 5 in figure B4 (can occur as well for curve 4, depending on the yielding displacement). The iterative process to find the PP was used to attain the point for curve 4 since at the intersection point with the 20% inelastic demand its evident that the ductility related to that point is lower than 4, so a new damping value must be found.
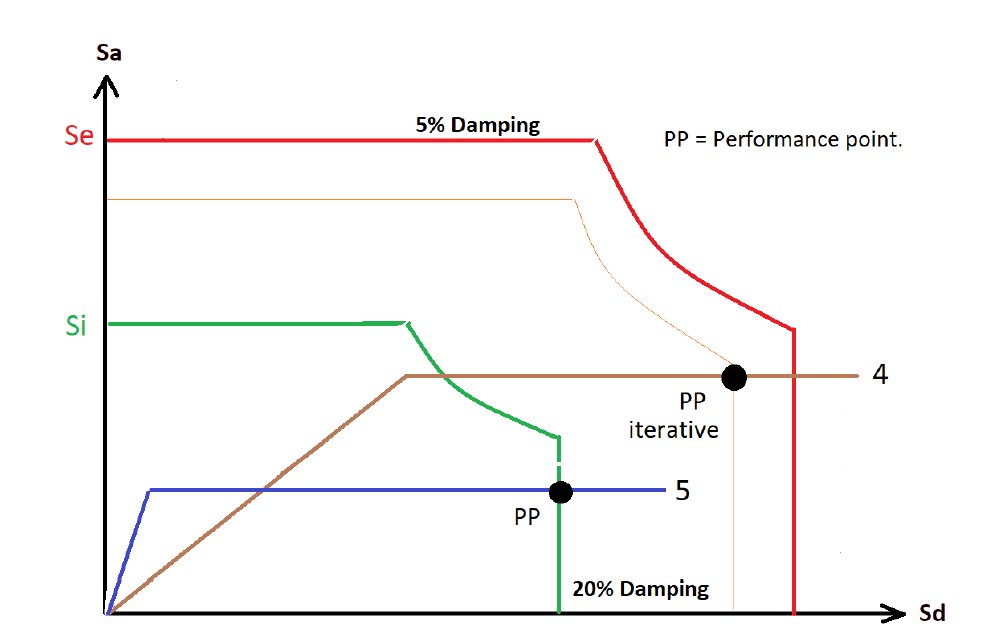
Figure - B4-PP for ductility over or below 4 and intersections at the constant velocity or constant displacement segments of the inelastic seismic demand spectrum.
Note
For the implementation in viiapackage, please check How to select the critical pushover curves
Performance point ‘PP’ for NPR non-compliant structures
The performance point for NPR 9998:2018 non-compliant bilinear spectral curves is not required to be calculated. The ratio reflected in the %NBS (as commented section 4.9.1, stage 10) can be used to reflect the gap in capacity of the structure to the seismic demand. This parameter can be used to estimate the required reinforcement measures.